Pater Tenebrarum
My articles My siteAbout meMy booksMy videos
Follow on:TwitterFacebook
Seeking Alpha
Another Shoeshine Boy Moment We recently pondered the markets while trying out our brand-new electric soup-cooling spoon (see below). We are pondering the markets quite often lately, because we believe tail risk has grown by leaps and bounds and we may be quite close to an important juncture, i.e., the kind of pivot that can generate both a lot of excitement and a lot of regret all around. Provided one manages to grasp the nettle with the proper combination of preparation and luck, the emphasis may be on excitement rather than regret. Photo credit: Hans Reinhart / Getty Images - Click to enlarge Modern soup-cooling spoon for the sophisticated gourmet. We are not the gentleman in the picture, we don’t even know
Topics:
Pater Tenebrarum considers the following as important: Chart Update, Credit Markets, Debt and the Fallacies of Paper Money, Featured, newslettersent, On Economy, The Stock Market
This could be interesting, too:
Vibhu Vikramaditya writes Navigating the Slippery Slope: How Hoover’s Interventions Paved the Way for the Great Depression
Ryan McMaken writes Frédéric Bastiat Was a Radical Opponent of War and Militarism
Douglas French writes Millennials: In Costco We Trust
Joseph T. Salerno writes What Fed “Independence” Really Means
Another Shoeshine Boy MomentWe recently pondered the markets while trying out our brand-new electric soup-cooling spoon (see below). We are pondering the markets quite often lately, because we believe tail risk has grown by leaps and bounds and we may be quite close to an important juncture, i.e., the kind of pivot that can generate both a lot of excitement and a lot of regret all around. Provided one manages to grasp the nettle with the proper combination of preparation and luck, the emphasis may be on excitement rather than regret. |
 Photo credit: Hans Reinhart / Getty Images - Click to enlarge Modern soup-cooling spoon for the sophisticated gourmet. We are not the gentleman in the picture, we don’t even know him, we just wanted to show this nifty spoon in operation. Once you have one, you will wonder how civilized life was even possible before it. |
| We let all the bits and pieces of data and information at our disposal parade before our mind’s eye, hoping they would confess under its stern gaze. Of course no such confession could be obtained, but eventually, a thought occurred to us. This is known to happen from time to time.
Before we get to that, we wanted to report on another “shoeshine boy” moment a good friend related to us a few days ago via e-mail:
Complete strangers standing in a line at a battery store striking up conversations about bitcoin and FANG stocks out of the blue? That is definitely a signal of sorts. It is of course a good bet that whatever speculation caught their fancy, has probably already made them more money within just the past few days than the yields investors in government bonds can hope to earn over the the entire next century (+/-). It actually makes one wonder why anyone would buy a German 10-year Bund yielding 30 basis points. At least it is no longer trading at a negative yield-to-maturity. Around $9.7 trillion in government debt are still privileged to remain in that bizarre territory. Since bonds with negative yields implicitly suggest that the arrow of time has magically reversed for some people, we cannot be entirely sure if reports claiming they exist aren’t actually infiltrating our world from a parallel universe. |
Relative Strength Index, Feb 2013 - Dec 2017 10 year German government debt yields a little over 30 basis points per year these days. - Click to enlarge The universe in which buying these bonds makes sense is probably not ours – although it may make sense under certain circumstances: e.g. if one fears an imminent implosion of the banking system, or if a certain common currency threatens to fall prey to spontaneous combustion; or when financial repression type legislation puts the opportunity cost into a surprising fresh perspective. Currently everybody insists that everything is perfectly fine though. The economy is humming everywhere, and all these bad things belong to the distant past, an age of financial darkness we have put so thoroughly behind us, we might as well excise it from history and forever banish it to the memory hole. |
| Anyway, we don’t want to digress too much – let us just say that there are quite a few oddities we can observe in markets these days. That is perhaps not too big a surprise if one considers that we have just experienced a decade of “unconventional monetary policy” – the modern euphemism for “central banks printed a lot of money”.
Anyway, we have mentioned another “shoeshine boy” moment previously, which occurred back in July of this year. Along similar lines, we note that various quantifiable sentiment and positioning data have regularly generated new extremes in recent years – many to such an extent that we doubted they could ever reach even greater extremes. And yet, they all did. Peak InsanityAs we always point out: most of these data are usually not very good timing indicators. But from data that go very far back (such as e.g. mutual fund cash reserves), we tentatively conclude that the longer the time period over which extreme readings are recorded, the bigger and more persistent the eventual downtrend will become, so there is actually some information in the fact that they haven’t “worked” so far. Given this latest tidbit of anecdotal information, we decided to show some recent examples. Something remarkable has actually happened over the entire breadth of sentiment and positioning-related time series in recent months: almost all of them have either put in new records or have at a minimum revisited old records (which in some cases were established three decades ago). A chart we haven’t updated here for some time is our collection of various Rydex ratios. These represent a small sample size in terms of AUM, but they nevertheless reflect general sentiment quite well, and their message is usually mirrored elsewhere. For starters, here is a subset, namely the leveraged bull/bear ratio, which as the name implies compares the amounts committed to leveraged strategies (yes, it made a new record high): |
Rydex Total Leveraged Bull, Jul 2010 - Dec 2017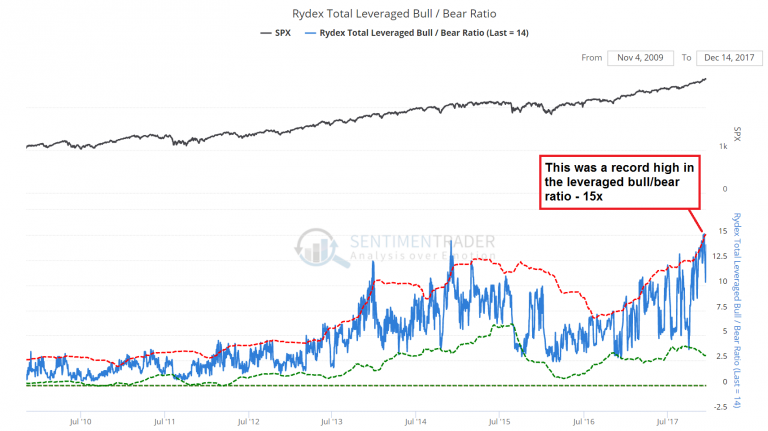 There was a time when a ratio of 2.5 to 3.0 was considered “extreme”, but recently it actually reached a rather more lofty level of 15. - Click to enlarge We are in danger of running out of sufficiently descriptive adjectives |
| There was no need to do a lot of editing of the annotations we previously added to our “general Rydex overview” chart – everything has simply become even more insane: |
Total Assets Rydex Moneymarket, 2002 - 2018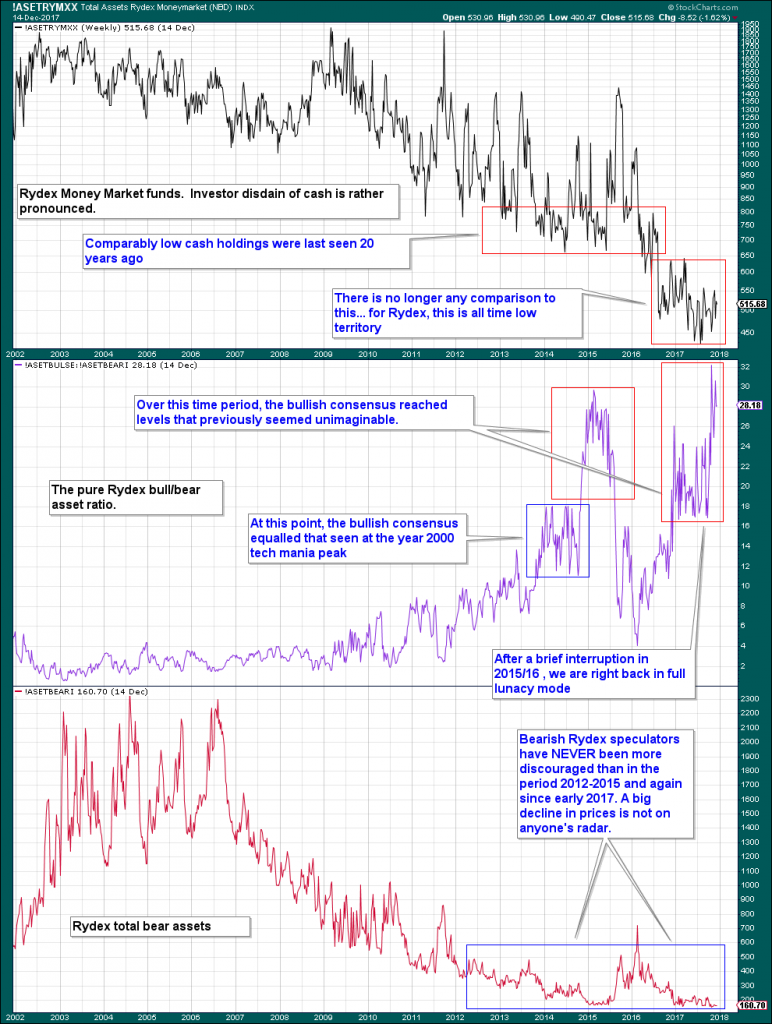 Rydex overview – same old: cash holdings plunge to new lows, and bear assets do likewise. - Click to enlarge The recent spike in the pure bull/bear ratio to a new record high above 32x exceeded the year 2000 peak by almost 100% |
| A chart of another not very widely followed positioning indicator was recently published by EWI in its monthly market report – it depicts hedge fund exposure to the stock market. Actually, it is “merely” at the second-highest reading in the indicator’s history. The highest reading was observed in July of 2007, which was obviously not the most propitious moment in time to be record net long. |
Hedge Funds, 2005 - 2017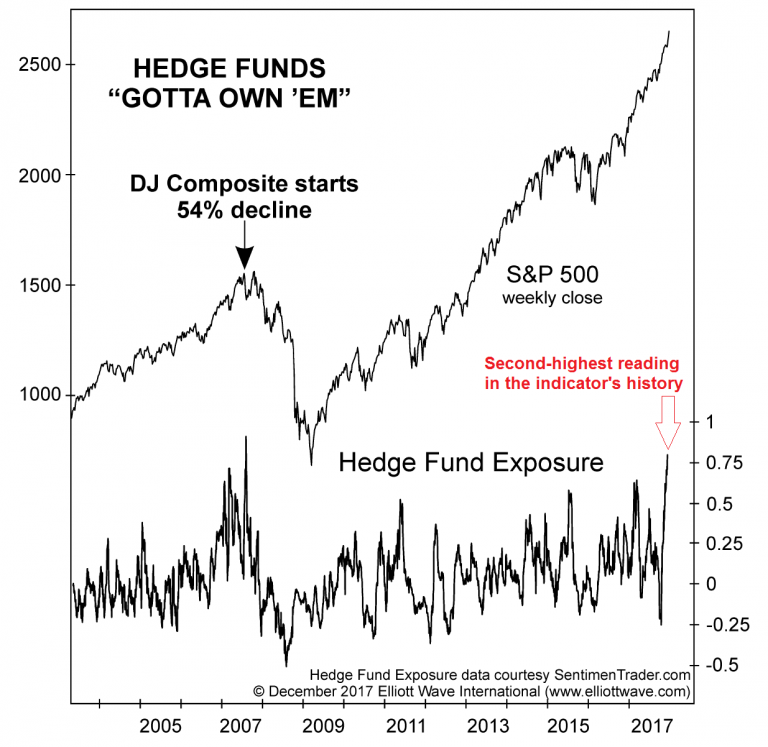 Hedge funds were rarely more in love with stocks than today (in fact, only once). - Click to enlarge As trend followers they tend to herd and the herding tends to become extreme near major turning points – which is when they are “collectively wrong”. Admittedly this is a very volatile and usually short term oriented indicator, but record highs and lows seem to be quite meaningful with respect to impending medium to long term turning points. |
| There are a few other new extremes reported by investment funds though – for instance, the percentage of fund managers taking part in the Merrill Lynch survey stating that their risk exposure is “above normal” has reached a new record high this November as well (this reminds us of how some value-focused fund managers threw the towel and started buying dotcoms in late 1999/ early 2000).
The National Association of Active Investment Managers reported a new record high in its exposure index just last week. Oh well, at least the most bearish active fund manager in the survey was “only” 75% net long, instead of being leveraged long. |
NAAIM Exposure Index, Sep 2006 - Dec 2017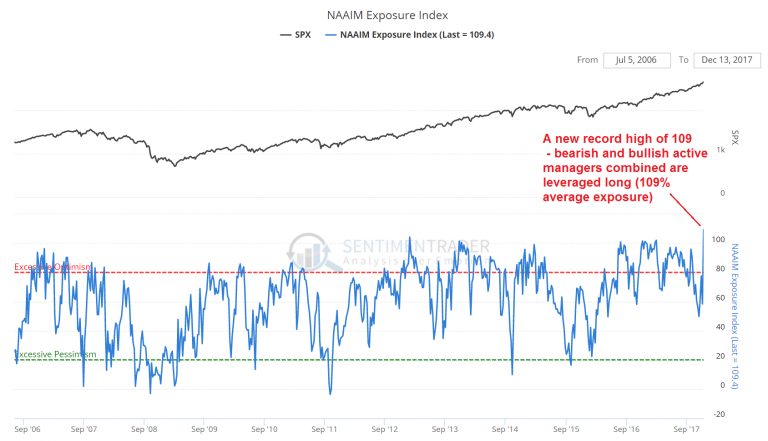 Another new record in unanimity – collectively, the active managers in the NAAIM survey were 109% net long as of last week, with the biggest “bear” holding net long exposure of 75% - Click to enlarge |
| We could continue with this for many more pages, but suffice it to say that the investing public – whether of the institutional or retail variety – is largely of one mind these days. People seem to have come to the conclusion that there is no downside risk, which means one might as well just close one’s eyes and go long, valuations be damned (and by now we have heard from more than one source that “valuations no longer matter” – or more precisely, overvaluation is no longer deemed worthy of concern).
This is quite amusing from a timing perspective, as the market’s Shiller P/E ratio has just recently eclipsed the record set in 1929 (only the record set by the tech mania peak of early 2000 remains standing in this respect). We would guess that the complete absence of downside volatility in the market since the hicc-ups of mid 2015/ early 2016 is behind this strange equanimity with respect to valuations. Obviously this has also herded speculators into massively shorting the VIX at record lows – and the practice of “selling vol” has become a kind of “free money” generator for all kinds of investors who should probably not dabble in this kind of trade (see Mish on “everyone in the room is selling vol”). This is very much like shorting CDS prior to the GFC, which was also seen as a fount of “free money” by all sorts of not very sophisticated outfits, including a number of European cooperative banks (credit unions & thrifts, often with rural roots) which were previously focused on administering savings and making very conservative mortgage loans. Quite a few of them went belly-up in the 2008 crisis when they could no longer afford the margin calls on their CDS books. It all rests on a base of insanity and the insane all think they are geniuses (a sudden proliferation of geniuses is a well-known late stage bull market effect). |
 - Click to enlarge |
Tags: Chart Update,Credit Markets,Featured,newslettersent,On Economy,The Stock Market