See the introduction and the video for the terms gold basis, co-basis, backwardation and contango. Precious Metals Supply and Demand Report The price of gold dropped , and that of silver 60 cents this week. This is a far cry from Sep 8, when the price of silver hit .21. Since then, it’s been almost all downhill. What happened? Since the beginning of last month, the price of silver had been rising and at the basis along with it. The basis is the price of the futures contract minus the spot price. A rising price and basis is telling us that buyers are pushing up the price — of futures. By arbitrage, the price of the metal is pulled up too, but it trails. Another way to describe this is to say that the marginal
Topics:
Keith Weiner considers the following as important: Chart Update, dollar price, Featured, Gold and its price, gold basis, Gold co-basis, gold silver ratio, newsletter, Precious Metals, silver basis, Silver co-basis
This could be interesting, too:
Vibhu Vikramaditya writes Navigating the Slippery Slope: How Hoover’s Interventions Paved the Way for the Great Depression
Ryan McMaken writes Frédéric Bastiat Was a Radical Opponent of War and Militarism
Douglas French writes Millennials: In Costco We Trust
Joseph T. Salerno writes What Fed “Independence” Really Means
See the introduction and the video for the terms gold basis, co-basis, backwardation and contango.
Precious Metals Supply and Demand ReportThe price of gold dropped $24, and that of silver 60 cents this week. This is a far cry from Sep 8, when the price of silver hit $18.21. Since then, it’s been almost all downhill. What happened? Since the beginning of last month, the price of silver had been rising and at the basis along with it. The basis is the price of the futures contract minus the spot price. A rising price and basis is telling us that buyers are pushing up the price — of futures. By arbitrage, the price of the metal is pulled up too, but it trails. Another way to describe this is to say that the marginal buyer of silver metal is the market maker, who warehouses it for the futures buyer. If this is the marginal demand, then it’s a bearish indicator because it could disappear and become the marginal supply. That is what has happened for the last two weeks. The closing price peaked on Sep 7, and has been dropping since then. Along with it, the basis has been falling. Both the August through Sep 7 trend of rising price and basis, and the Sep 8 through present trend of falling price and basis show us something clearly that cannot be seen on other graphs. These moves are caused by speculators positioning themselves and then closing their positions again. Two facts in this round trip are unfortunate for silver speculators. One, when the price was rising, the basis was rising. Real demand dropped off while speculative demand is only temporary. Two, when the price came back down the basis did not fall that much. The fundamental silver price that we calculate daily began falling after 8 September. One might wish for the price to skyrocket, but one must respect the data. The data does not guarantee that the price could not hit $20 or perhaps even $22. But it shows that there is no reason for it to do so, and the more the price rises, the stronger are the forces pulling it back down. We are not in the same short-term interest rate environment that existed during most of the last 9 years. This is reflected in the cost of carry for all trades. In the case of silver, the silver forward rate shows that the offered rate (what a trader would pay to carry silver for 6 months) was around 0.5% at the end of 2015, but has since gone up to about 2%. We assume that silver speculators are more mindful of the cost, and likely to close positions sooner at this higher rate. If that is so, then expect speculative moves to end sooner and maybe even silver to spend more time trading below its fundamental price than previously. |
Silver Spot Daily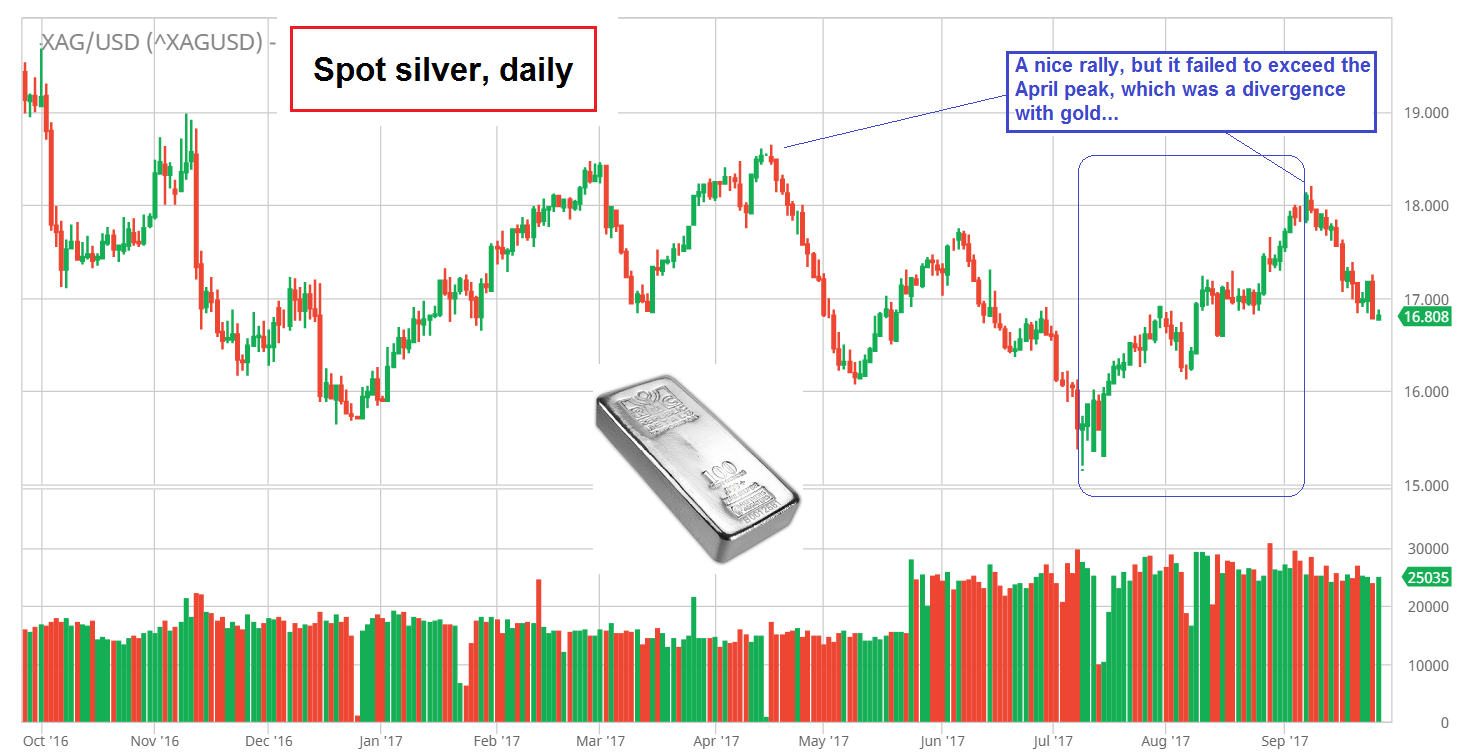 Spot silver, daily. The rally was quite sizable, but at the peak a divergence with the gold price emerged (gold exceeded its April high, while silver failed to do so). - Click to enlarge That is not always meaningful, but it is always a “heads-up”, particularly when prices have already trended for a while. Silver obviously remains stuck in a medium term trading range for now. The longer this continues, the more meaningful an eventual breakout in prices will be. |
Fundamental DevelopmentsWe will look at an updated picture of the fundamentals of supply and demand of both metals. But first, here are the charts of the prices of gold and silver, and the gold-silver ratio. Next, this is a graph of the gold price measured in silver, otherwise known as the gold to silver ratio. The ratio rose. |
Gold and Silver Prices(see more posts on Gold prices, silver price, )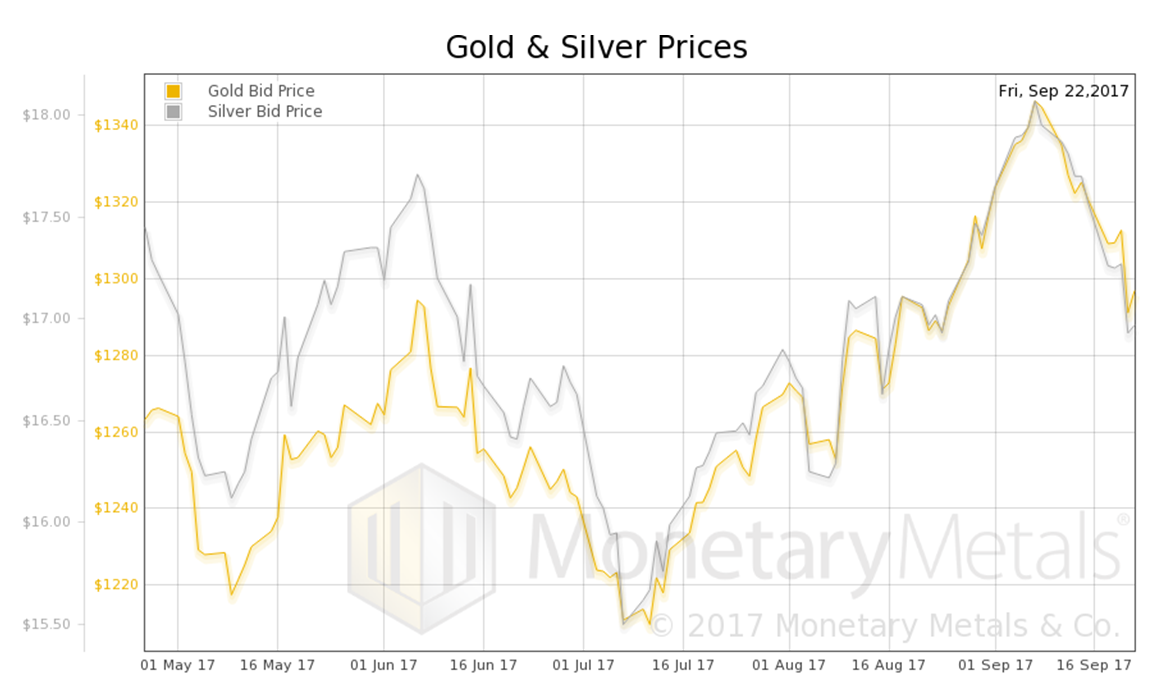 Gold and silver prices in USD - Click to enlarge |
Gold:Silver Ratio
|
Gold:Silver Ratio(see more posts on gold silver ratio, ) Gold-silver ratio, bid and offer - Click to enlarge |
Gold basis and Co-Basis and the Dollar Price
Here is the gold graph. |
Gold Basis and Co-basis and the Dollar Price(see more posts on dollar price, gold basis, Gold co-basis, )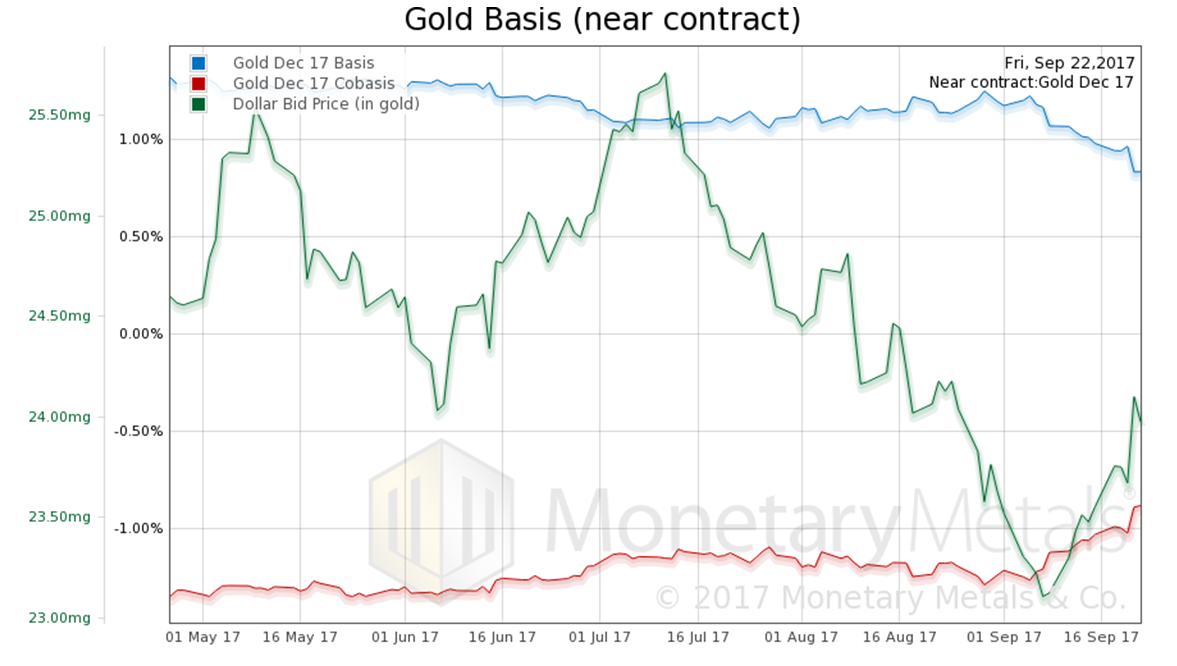 Gold basis, co-basis and the USD priced in milligrams of gold - Click to enlarge |
Silver Basis and Co-basis and the Dollar PriceThe dollar is up some more (the inverse of the falling price of gold). The co-basis (red line, scarcity) is up a bit. Our calculated Monetary Metals gold fundamental price actually increased $8 to $1,378. Now let’s look at silver. This is the time of year when both metals have the same active contract month, December. This means the near contract basis has the same duration, and we can make a direct comparison. The gold co-basis is -0.88%, and for silver it is -0.82%. This would paint a picture of silver being the scarcer metal. However, with silver’s poorer liquidity, we generally see a lower basis / higher co-basis in the near contract. The fact that they are so close actually indicates that gold is likely to be scarcer. |
Silver Basis and Co-basis and the Dollar Price(see more posts on dollar price, silver basis, Silver co-basis, ) Silver basis, co-basis and the USD priced in grams of silver - Click to enlarge |
This is why we calculate a continuous basis, to take out the propensity to fall inherent in the near contract. The continuous gold cobasis is -1.24% and for silver it is -1.38%.
Our calculated Monetary Metals silver fundamental price fell $0.06 to $17.32 (recall from gold above, the fundamental price is up $8).
For whatever reason, call it “risk off”, call it “no one wants silver in a potential war with a nuclear power”, call it “soft industrial demand for metals”, silver is weaker than gold at this time.
We calculate a fundamental gold-silver ratio of around 79.5
Tags: Chart Update,dollar price,Featured,gold basis,Gold co-basis,gold silver ratio,newsletter,Precious Metals,silver basis,Silver co-basis