Pater Tenebrarum
My articles My siteAbout meMy booksMy videos
Follow on:TwitterFacebook
Seeking Alpha
US Money Supply Growth Stalls Our good friend Michael Pollaro, who keeps a close eye on global “Austrian” money supply measures and their components, has recently provided us with a very interesting update concerning two particular drivers of money supply growth. But first, here is a chart of our latest update of the y/y growth rate of the US broad true money supply aggregate TMS-2 until the end of June 2018 with a 12-month moving average. Bank credit expansion in the US has recently recovered a little further, with commercial and industrial loans growing at 5.33% y/y as of the end of June and total US bank lending growth reaching 3.91% y/y (which is still nothing to write home about). The rise in C&I lending is
Topics:
Pater Tenebrarum considers the following as important: 6) Gold and Austrian Economics, 6b) Austrian Economics, 7) Markets, Central Banks, Featured, newsletter, On Economy
This could be interesting, too:
Vibhu Vikramaditya writes Navigating the Slippery Slope: How Hoover’s Interventions Paved the Way for the Great Depression
Ryan McMaken writes Frédéric Bastiat Was a Radical Opponent of War and Militarism
Douglas French writes Millennials: In Costco We Trust
Joseph T. Salerno writes What Fed “Independence” Really Means
US Money Supply Growth StallsOur good friend Michael Pollaro, who keeps a close eye on global “Austrian” money supply measures and their components, has recently provided us with a very interesting update concerning two particular drivers of money supply growth. But first, here is a chart of our latest update of the y/y growth rate of the US broad true money supply aggregate TMS-2 until the end of June 2018 with a 12-month moving average. Bank credit expansion in the US has recently recovered a little further, with commercial and industrial loans growing at 5.33% y/y as of the end of June and total US bank lending growth reaching 3.91% y/y (which is still nothing to write home about). The rise in C&I lending is consistent with the scramble for capital associated with the late stages of a boom: it comes amid rising interest rates, a rapidly flattening yield curve and rising CPI. However, the sum of demand deposit liabilities in the US banking system plus outstanding currency was recently growing at an anemic 3.2% y/y (which shows the strong effect of Treasury deposits on domestic TMS-2 growth – mainstream money supply aggregates do not include this item). At the same time CPI has recently jumped to 2.9% y/y – this continues to be highly reminiscent of the convergence between these growth rates in 1987, early 2000 and 2007-2008. |
US TMS-2: y/y growth rate with 12-month moving average.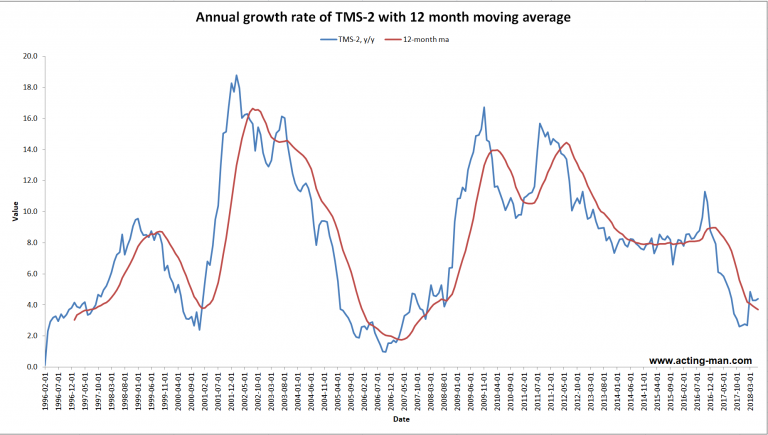 - Click to enlarge US TMS-2: y/y growth rate with 12-month moving average. Since the short term spike in March (we believe this was largely driven by repatriation), broad US money supply growth has stalled and currently stands at 4.4% y/y. Traces of the repatriation effect remain in evidence, as US Treasury deposits with the Fed remain at around USD 348 billion, a historically still very large amount. The 12-month moving average of TMS-2 growth continues to decline and has reached a new multi-year low of 3.7% (the lowest reading in the 12-month ma since February 2008). |
| Here is an update of G3 TMS growth (US, Japan and euro area) until the end of May; money supply growth in the euro area bounced back slightly to the 7% level in June after reaching a new low for the move of 6.5% y/y in May.
The upshot of the above is that the ice on which the asset bubble is skating continues to become ever thinner. In the US the 2.7% y/y low in TMS-2 growth reached in February is the decisive figure (growth in the more volatile narrow measure TMS-1 even fell below 2% y/y). The lagged effect of this slowdown will become noticeable almost regardless of what happens next (the 12-month moving average helps with capturing this lag to some extent). Risk asset prices and the economy were extremely resilient so far, but that is actually quite normal. As the long term chart above reveals, the lag between a slowdown in money supply growth and its effects on economic activity and asset prices can be substantial and is by no means “fixed”. The shift in relative prices that begins with a rise in the rate of change of CPI near the end of a boom is subject to leads and lags as well. Usually a surge in CPI precedes an eventual decline in asset prices from market peaks, while it lags the subsequent upturn in asset prices from bear market lows. Given the recent sideways move in TMS-2 growth, what has actually changed? |
G3 TMS growth rates as of the end of May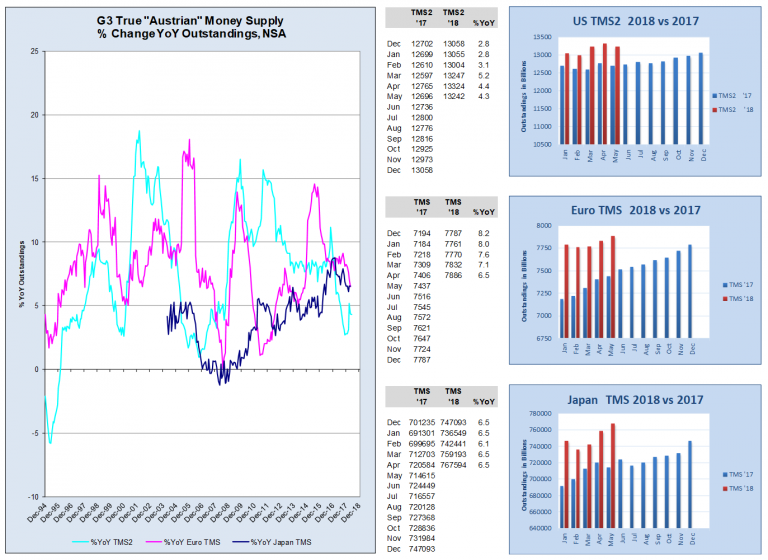 - Click to enlarge G3 TMS growth rates as of the end of May (US, Japan, euro area). Money supply growth has slowed sharply in all three major currency areas – a combination of base effects and the reversal of QE in the US and the slowdown of QE in Europe and Japan have contributed to this trend. Bank lending growth is generally recovering, but remains anemic by historical standards. |
For the First Time Since the Beginning of “QT” Net Fed Credit DeclinesMichael has pointed a recent new development out to us that looks potentially quite important. As long-term readers are probably aware, the fall in the y/y growth rate of TMS-2 since the November 2016 interim peak was largely driven by declining bank lending growth. After all, from the end of QE3 until September 2017, the Fed kept the size of its balance sheet stable, neither adding to the money supply nor decreasing it. We neglected to keep an eye on outstanding reverse repos in recent months. The Fed has actually stopped publishing charts on total reverse repos outstanding as of June 13. Since the total amount has recently converged with reverse repos with foreign official and international accounts, we suspect there are no longer any open reverse repo agreements with domestic institutions. Here is the chart: The Fed also no longer charts the item “securities held outright” separately. At first we thought that this would make it difficult to follow the changes in its holdings as a result of QT, but if it no longer has any reverse repo agreements with domestic banks, there is presumably no need to report these items separately (we will keep our readers posted on this). It is precisely these two items that are actually important to the subject at hand. As a reminder: the Fed started to enter into reverse repo transactions with domestic institutions in early 2014, while QE3 was still underway. Initially this was declared to be a test designed to ascertain that the eventual draining of excess liquidity would go smoothly. We believe though that commercial banks, primary dealers and the Fed were also getting antsy over the sizable surge in delivery fails at the time, as QE increasingly created shortages in certain off-the-run treasuries. |
Reverse repos 2009-2018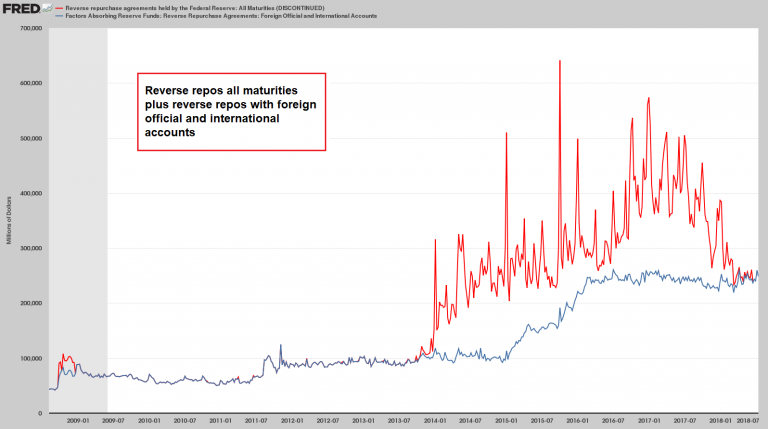 - Click to enlarge Reverse repo agreements with the Fed: all maturities in red, foreign official accounts in blue. |
| For banks it was apparently a case of having too much liquidity and not enough high quality securities. Reverse repos kept growing with large spikes occurring at the end of every quarter – a strong hint that they were associated with balance sheet window dressing and/or settlement periods. This changed with the beginning of “QT”: with the Fed lowering its monthly repurchases of maturing securities, the shortage of securities was gradually alleviated, and reverse repo agreements were increasingly no longer renewed.
As a matter of fact, reverse repos decreased faster than the Fed’s outright holdings of securities purchased under QE. The result was that net Fed credit outstanding was still USD 95 billion higher at the end of May 2018 than at the beginning of “QT” in September 2017! This is now beginning to change: in July year-on-year growth in total Fed credit outstanding turned negative for the first time since the birth of Methuselah. Here is a table that shows developments since the beginning of “QT”. In short, QT should begin to exert a far more noticeable impact on excess liquidity and the money supply from now on. The only countervailing trend is the recent acceleration in the pace of bank lending, but total bank credit growth actually still seems to be quite anemic. We have a feeling most market participants are not aware of these developments – at least we haven’t come across any discussion of how close the impact in terms of an outright decline in liquidity actually is. Note also that money supply growth is set to weaken even faster in real terms (i.e., adjusted for CPI). Something will have to give sooner or later – and it increasingly looks sooner rather than later. |
Fed credit update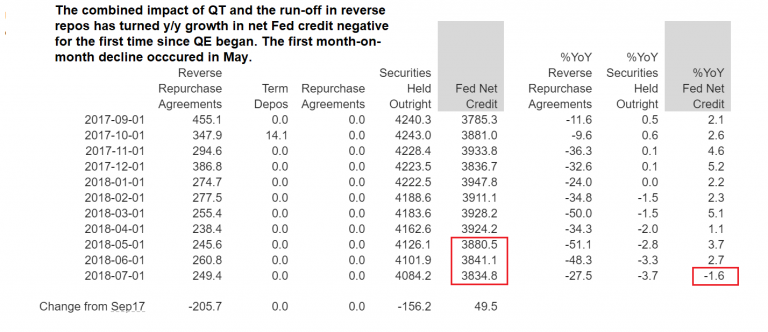 - Click to enlarge Change in reverse repos, securities held outright and net Fed credit outstanding. We have highlighted the first three month-on-month declines and the first y/y percentage decline in the latter in red. Note that the change in total Fed credit outstanding since the beginning of “QT” still stands at a positive USD 49.5 billion in absolute terms as of July to date. By the end of the month this figure should be smaller and sometime in August it should turn negative as well. |
Addendum: China Follows SuitSince we mentioned Japan and the euro area in passing above, we should probably also point out that there was recently a rapid slump in the growth rate of China’s narrow money supply M1, as if to add an exclamation mark to the broader money supply measure M2 reaching new multi-decade lows. Recently the PBoC has begun to try to reverse this trend by lowering minimum reserve requirements (a much more important policy tool in China than elsewhere) and occasionally injecting liquidity into overnight interbank lending markets. However, it finds itself in a delicate situation in view of the escalating trade dispute with the US. |
Both narrow (M1) and broad money supply (M2) growth rates in China have plummeted.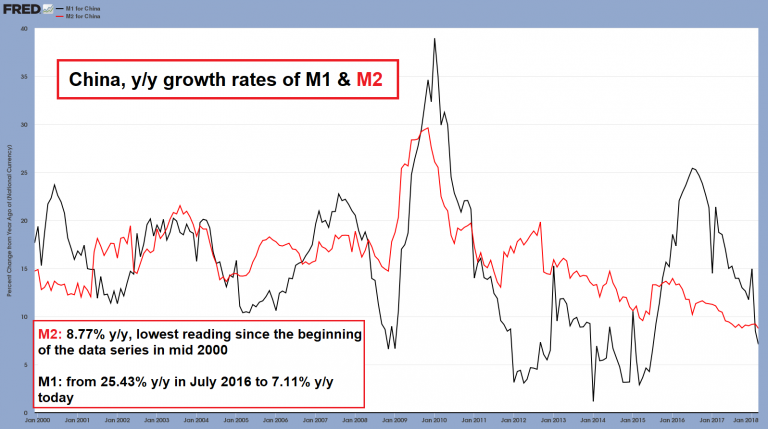 - Click to enlarge |
| Regardless of the background noise, China should begin to feel the lagged effects of this slowdown in money supply growth as well. Chinese stock prices have in fact already weakened quite a bit this year. |
 Running on empty – lately no-one seems to be able to find the Ctrl-P key combination anymoreIllustration by Walery Kachaev |
Charts and data by: acting-man.com, Michael Pollaro, St. Louis Fed
Tags: central banks,Featured,newsletter,On Economy