Pater Tenebrarum
My articles My siteAbout meMy booksMy videos
Follow on:TwitterFacebook
Seeking Alpha
A Movie We Have Seen Before – Repatriation Effect? There was a sizable increase in the year-on-year growth rate of the true US money supply TMS-2 between February and March. Note that you would not notice this when looking at the official broad monetary aggregate M2, because the component of TMS-2 responsible for the jump is not included in M2. Let us begin by looking at a chart of the TMS-2 growth rate and its 12-month moving average. Annual Growth Rate of TMS 2, Feb 1996 - 2018 - Click to enlarge The 12-month moving average nevertheless continued to decline and stands now at 4.1%. The sole component of TMS-2 showing sizable growth in March was the US Treasury’s general account with the Fed. This is included
Topics:
Pater Tenebrarum considers the following as important: 6) Gold and Austrian Economics, Chart Update, Credit Markets, Featured, newsletter, On Economy
This could be interesting, too:
Vibhu Vikramaditya writes Navigating the Slippery Slope: How Hoover’s Interventions Paved the Way for the Great Depression
Ryan McMaken writes Frédéric Bastiat Was a Radical Opponent of War and Militarism
Douglas French writes Millennials: In Costco We Trust
Joseph T. Salerno writes What Fed “Independence” Really Means
A Movie We Have Seen Before – Repatriation Effect?There was a sizable increase in the year-on-year growth rate of the true US money supply TMS-2 between February and March. Note that you would not notice this when looking at the official broad monetary aggregate M2, because the component of TMS-2 responsible for the jump is not included in M2. Let us begin by looking at a chart of the TMS-2 growth rate and its 12-month moving average. |
Annual Growth Rate of TMS 2, Feb 1996 - 2018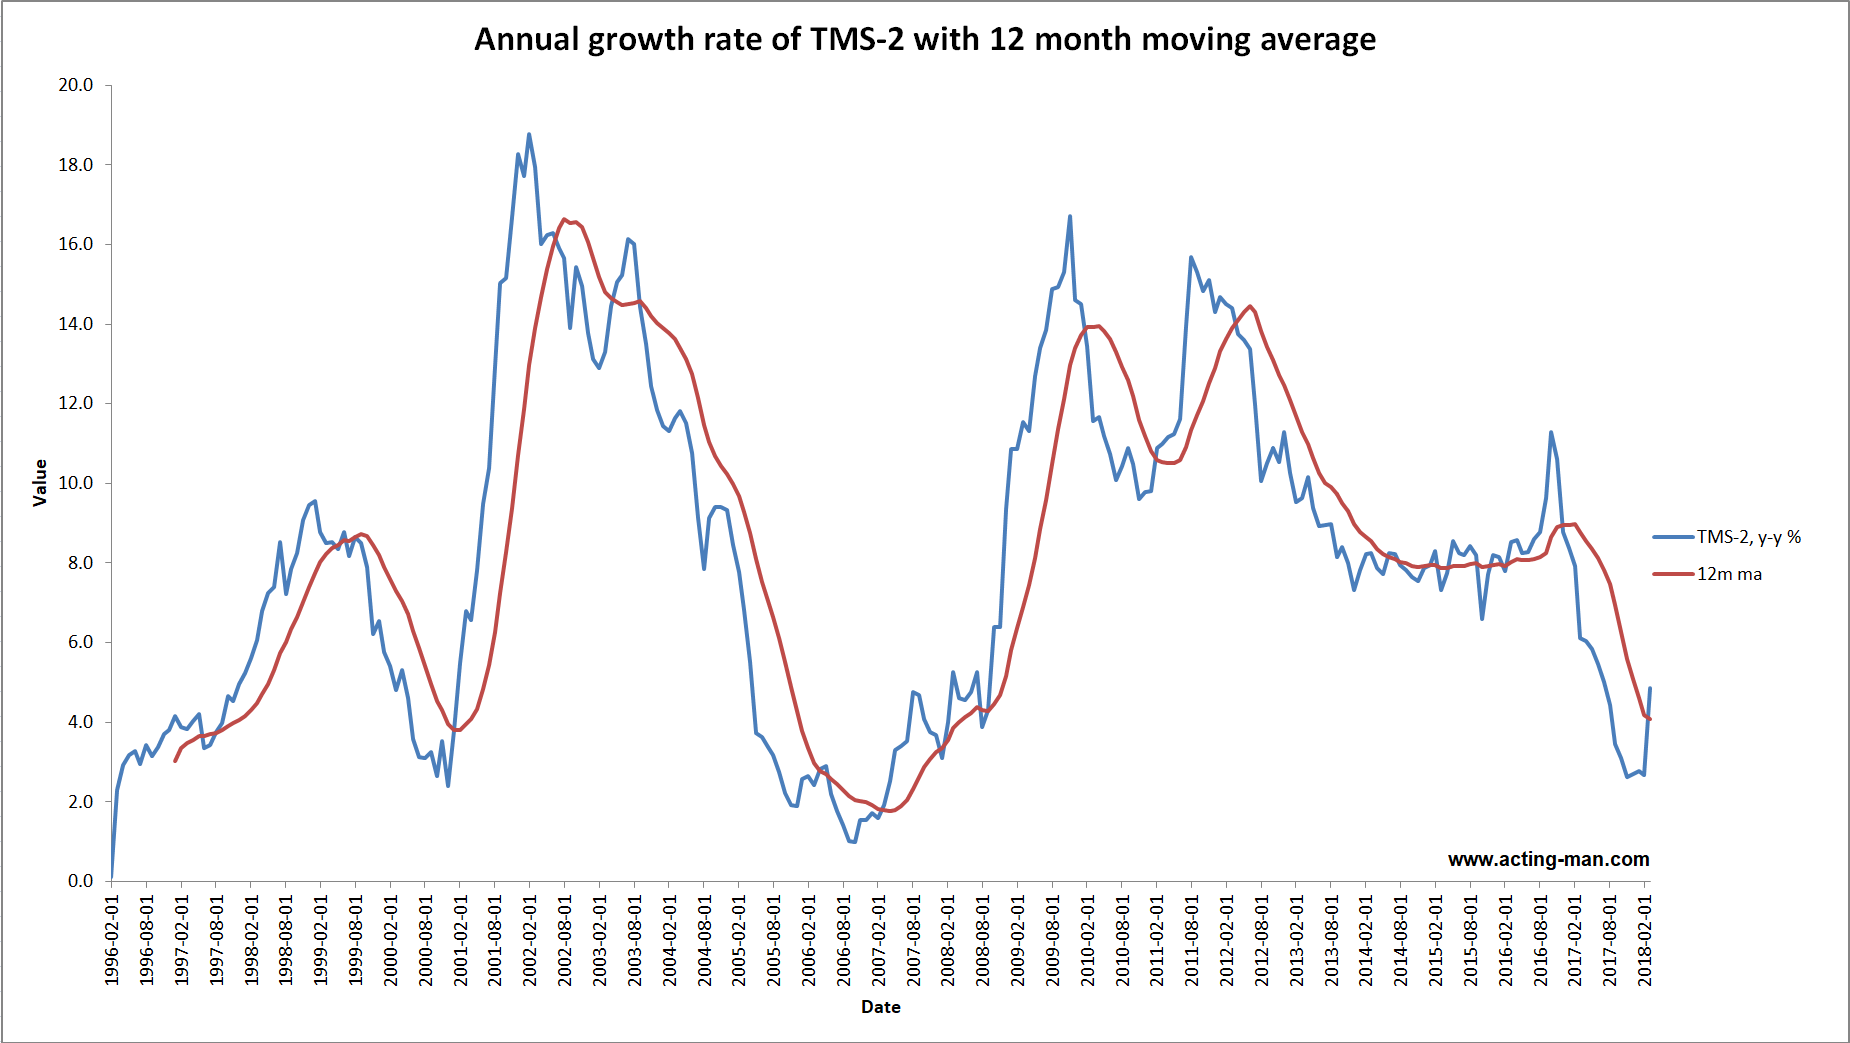 - Click to enlarge The 12-month moving average nevertheless continued to decline and stands now at 4.1%. |
| The sole component of TMS-2 showing sizable growth in March was the US Treasury’s general account with the Fed. This is included in the money supply because, well, it is money. The Treasury department will spend it, therefore this is not money that can be considered to reside “outside” of the economy (such as bank reserves).
We were wondering what was behind the spurt in the amount held in the general account. While there was a decline in the growth rate of US demand deposits, the slowdown in momentum did not really offset the surge in funds held by the Treasury. This reminded us of a subject discussed by the Treasury Borrowing Advisory Committee (TBAC) in the second half of 2016 in the wake of the change in money market fund regulations. This led to a repatriation of money MM funds previously lent out in the euro-dollar market to European issuers of commercial paper (mainly European banks). Readers may recall that there was a mysterious surge in the growth rate of the domestic US money supply (again, only visible in TMS 1 & 2) into November 2016, despite a lack of QE and no discernible positive momentum in the rate of change of inflationary bank lending growth. Concurrently there was a surge in LIBOR widely held to be “inexplicable” at the time – does that sound familiar? In short, after US money market funds were subjected to stricter regulations, they were no longer willing and able to take the risks associated with grabbing a yield pick-up in euro-land; instead they started buying t-bills. The TBAC was evidently well aware of the need to satisfy this sudden surge in demand, and the Treasury seems to have timed its t-bill auctions accordingly. We have a strong suspicion that the same thing has just happened again, only this time repatriation flows from US multi-national corporations in response to the Trump tax reform were the culprit. Here is a chart of the Treasury’s general account: |
US Government General Account at the Fed, Nov 2007 - Mar 2018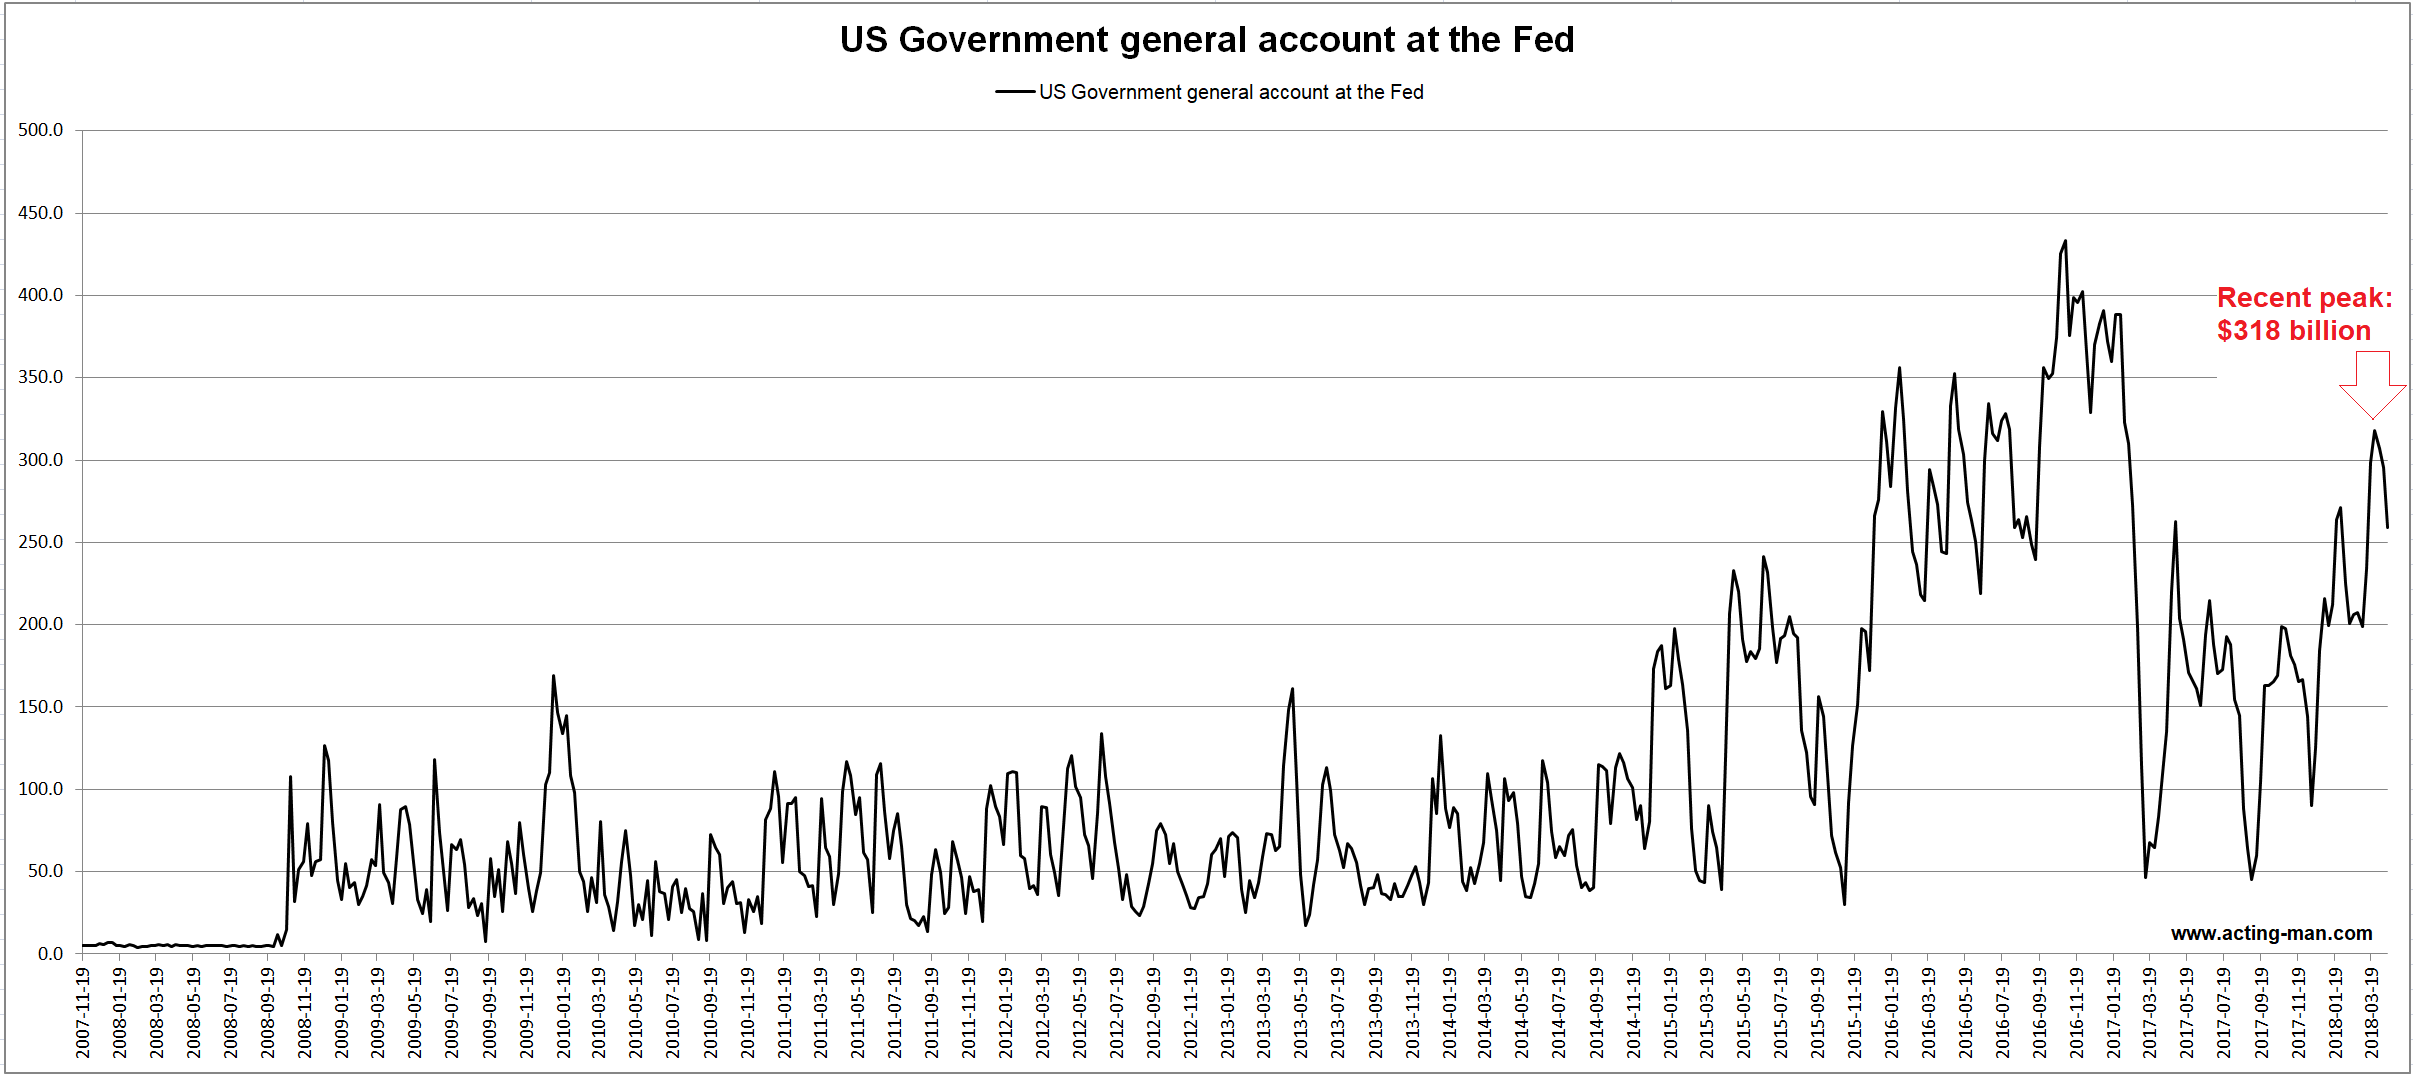 As you can see, right at the cut-off date for the monthly money supply data at the end of March, a new interim high of $318 billion was reached, which was almost a $120 billion jump from late February. - Click to enlarge It then decreased to $259 billion, but there was another jump to $343 billion in the week ending on April 23, which is not yet included in this chart (the data were updated one day after we made the chart). |
| The next chart shows the combined y/y growth rate of US currency plus demand deposits held at US commercial banks (in current and savings accounts) – i.e., the money supply without the memorandum items which are included in TMS-2 due to their “moneyness”. The y/y growth rate of currency plus demand deposits has actually declined to a new low for the move. |
Currency and Deposit Money, Dec 2002 - 2017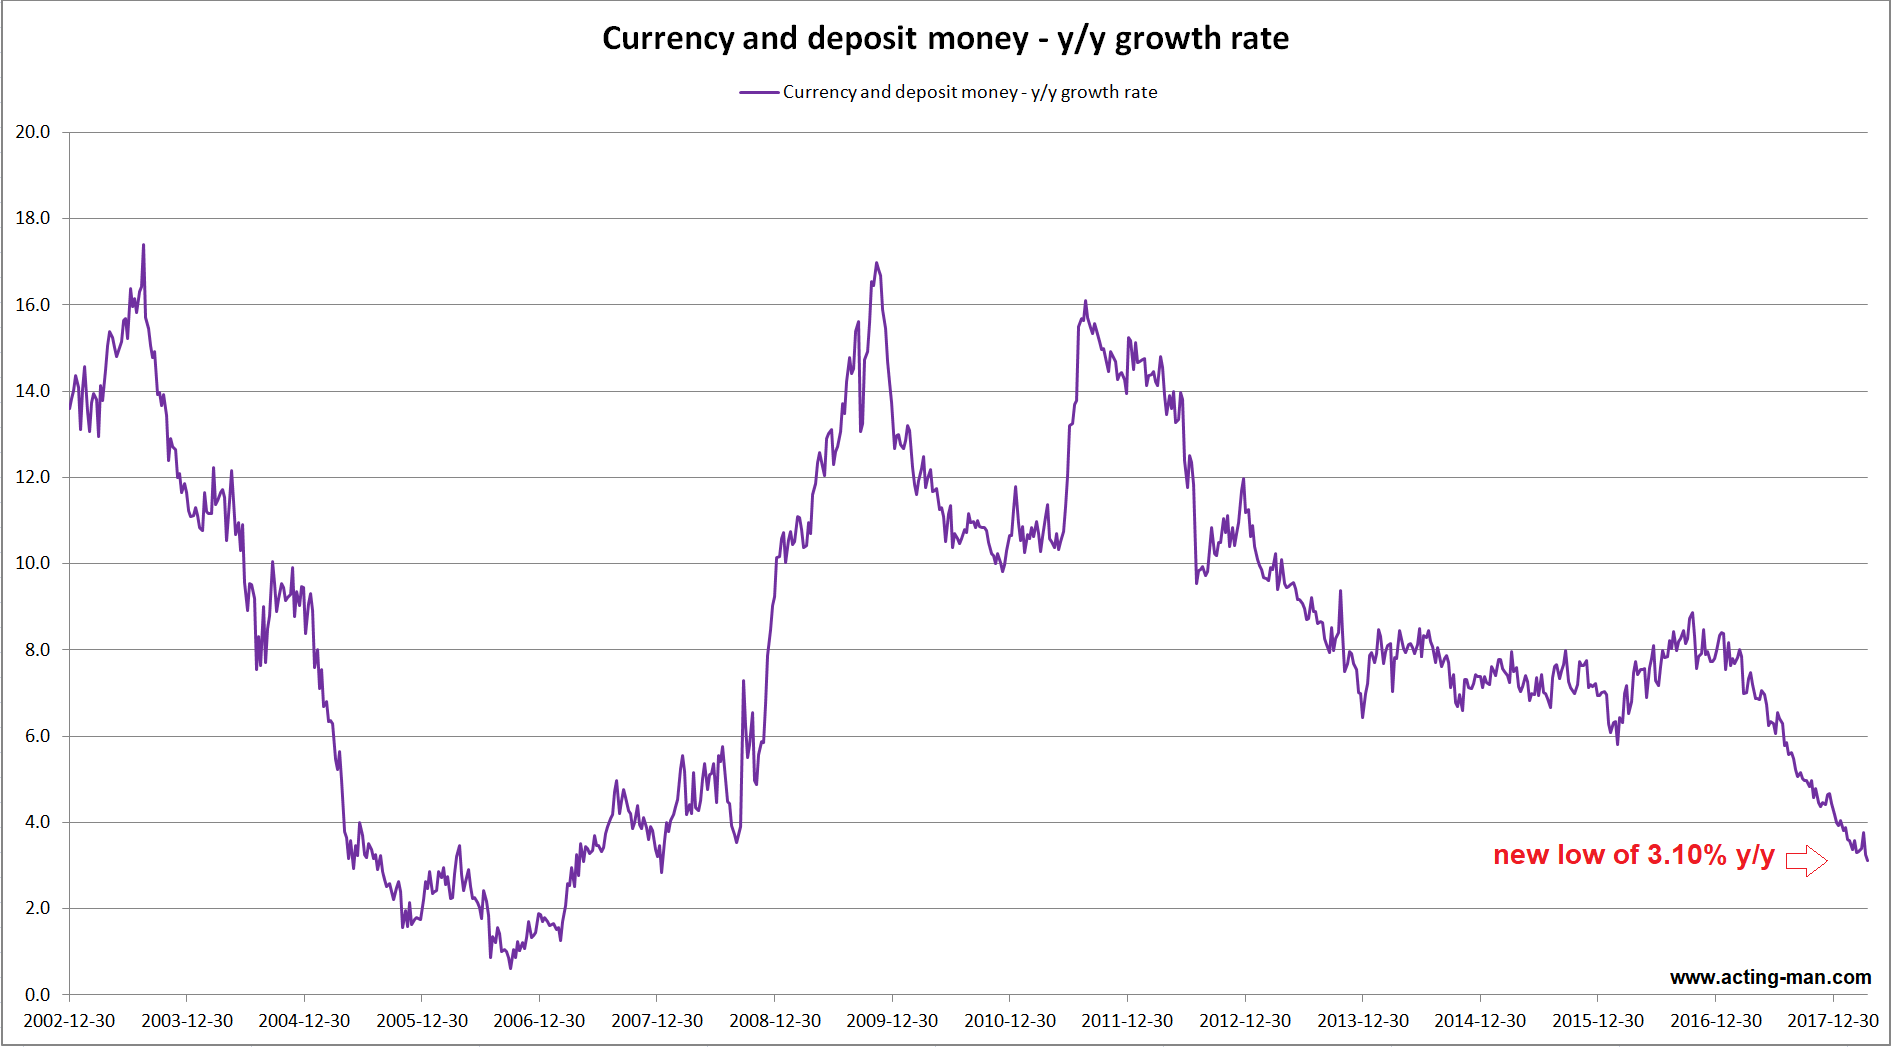 Growth in the major components of TMS-2 continues to slow (currency and demand deposits). - Click to enlarge Note here that the absolute figures did not decline month-on-month – the sum of these components merely grew more slowly than in the previous month (by a total of $45.2 billion m/m). |
And now for the next piece of the puzzle, namely total loan growth at commercial banks.
Total Credit Growth Stalls, C&I Lending Accelerates SomewhatFirst of all, y/y commercial and industrial loan growth has recovered from 0.31% as of Dec 6, 2017 to 3.50% as of April 25, 2018 – the highest reading since early March of 2017, even if it is still well below “normal”. This is actually consistent with companies beginning to scramble for capital that is scarcer than was previously thought, which is reflected by the sudden surge in short term interest rates (which the Fed is actually not causing at this juncture – it is trying to catch up with it). It is different for the majority of consumers: they are probably entering the “forced saving” stage of the cycle at the moment. Their borrowings are declining while consumer loan delinquencies are hitting new multi-year highs at the same time ($36.4 billion as of Q4 2017 – which is more than 50% above the peak level of the 2001 recession and 38% below the peak level of the 2007-2009 GFC). The next chart shows TMS-2 growth and total bank lending growth – the decrease in consumer loan demand is apparently more than offsetting the acceleration in C&I lending. In other words, inflationary bank lending is still very sluggish overall – which lends support to the idea that repatriation was primarily responsible for the jump in TMS-2 growth in March. If the domestic US money supply grows faster due to repatriations, it certainly means there is now more money in the economy than there would otherwise be. One should of course not ignore this money due to its provenance, although it is clear that this will be a kind of “one shot” increase that will eventually come to a halt. Still, for future developments it is seems more important to what extent bank lending growth may or may not manage to outweigh the effects of “QT” – the Fed’s balance sheet shrinkage exercise. Note also – the low in the y/y TMS-2 growth rate of just below 2.7% is still going to affect economic activity and asset prices with a lag, regardless of any short term re-acceleration in TMS-2 growth. Consider in this context that the low point in TMS-2 growth preceding the GFC actually occurred in October of 2006. |
TMS-2 Growth and Total Bank Lending, Feb 2014 - Mar 2018 Y/y growth in total bank lending has slowed again after a brief bounce in December of 2017 to a recent level of 3.35%, which indicates that the faster pace in business lending was offset by a decrease in consumer lending. - Click to enlarge |
Fed Assets and “Other-Other Money”On the “QT” front we notice that the Fed is beginning to catch up with where it “ought” to be – the previous lag of more than $60 billion in early April has shrunk to just a little over $25 billion. As discussed previously, the reason for this are MBS-related settlement issues, as there are unforeseeable prepayments and the Fed still rolls over whatever is not yet affected by the monthly reductions. Timing-wise this is difficult to reconcile, which is why its MBS holdings are moving lower in a zig-zag line. Here is the current state of affairs: |
Total Fed Assets, Jul 2014 - May 2018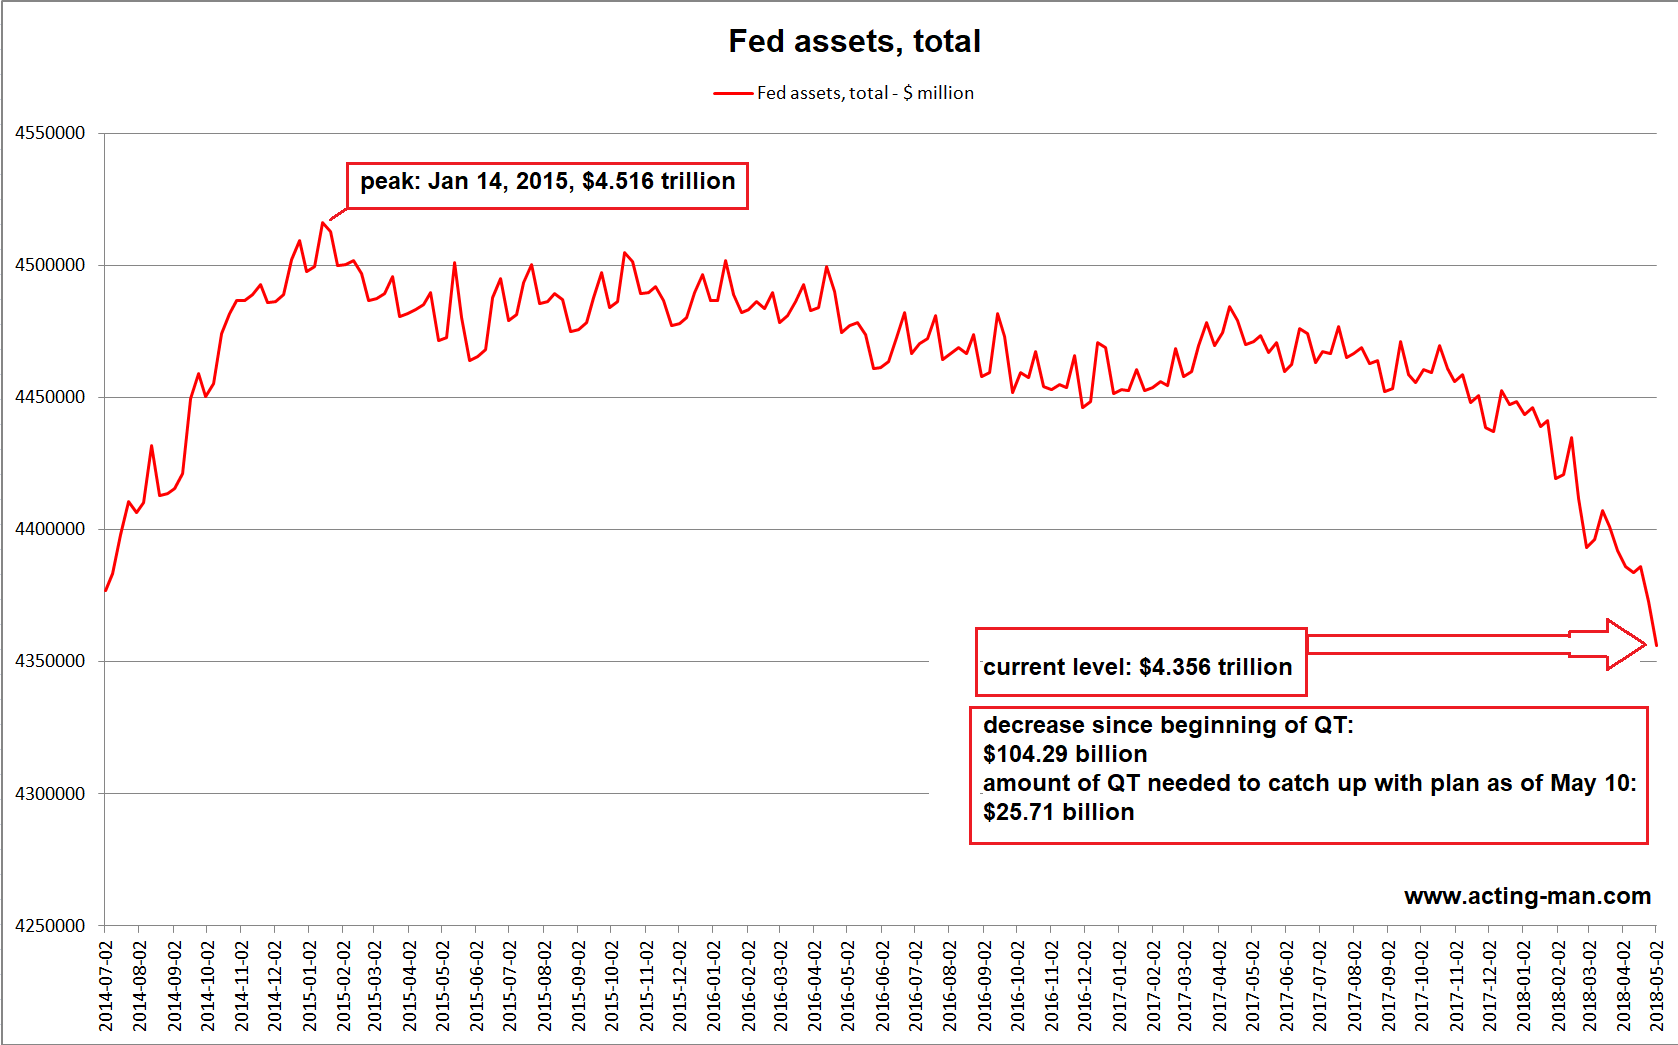 Since “QT” has begun, Fed assets have declined by $104.29 billion (vs. $130 billion that “should” have been reached by May 10, if we assign a quota of one third of the planned monthly amount to May). - Click to enlarge The calculation is: Oct. – Dec. 2017: $30 billion, Jan. – Mar. 2018: $60 billion and April – May 10 2018: $40 billion = $130 billion total. |
| Assuming that the “missing” ~$26 billion come off as well in the course of this quarter, a further decline of $76 billion would be in store until the end of June ($20 billion for the rest of May, and $30 billion for June to be added as well). The point is that the reduction in assets is accelerating. As discussed previously, this is definitely going to weigh on liquidity and will make it hard for already overvalued stocks to levitate further into the blue yonder.
Finally, here is a look at a memorandum item on the Fed’s balance sheet that should probably be included in TMS as well (as far as are aware it was not included hitherto). Its official title is “Deposits with Federal Reserve Banks, Other Than Reserve Balances: Other” – or in other words, “other other money”, or maybe “double-plus-other money”. Here is what this line item contains:
After reading up on it some more, we found out that the vast bulk of the funds in this account are cash balances of the GSEs (Fannie and Freddie). This is apparently where prepayments and occasional proceeds from bond sales accumulate, which are then distributed to investors again when MBS are redeemed. To our mind these balances (along with the smaller ones belonging to the other institutions listed above) should be considered money, since there are continually recurring two-way flows between this account and demand deposit accounts at banks. The mechanics seem not much different from those governing the Treasury’s general account. We would be interested to hear other people’s opinion on this point (perhaps we are overlooking something, but we don’t think so). We are inter alia mentioning this oddity because the balance it contains is not exactly chicken-feed and it has steadily, if jerkily, trended higher in recent years. To be precise, the account currently holds $74.5 billion: |
Deposits with Fed, Oct 2008 - Apr 2018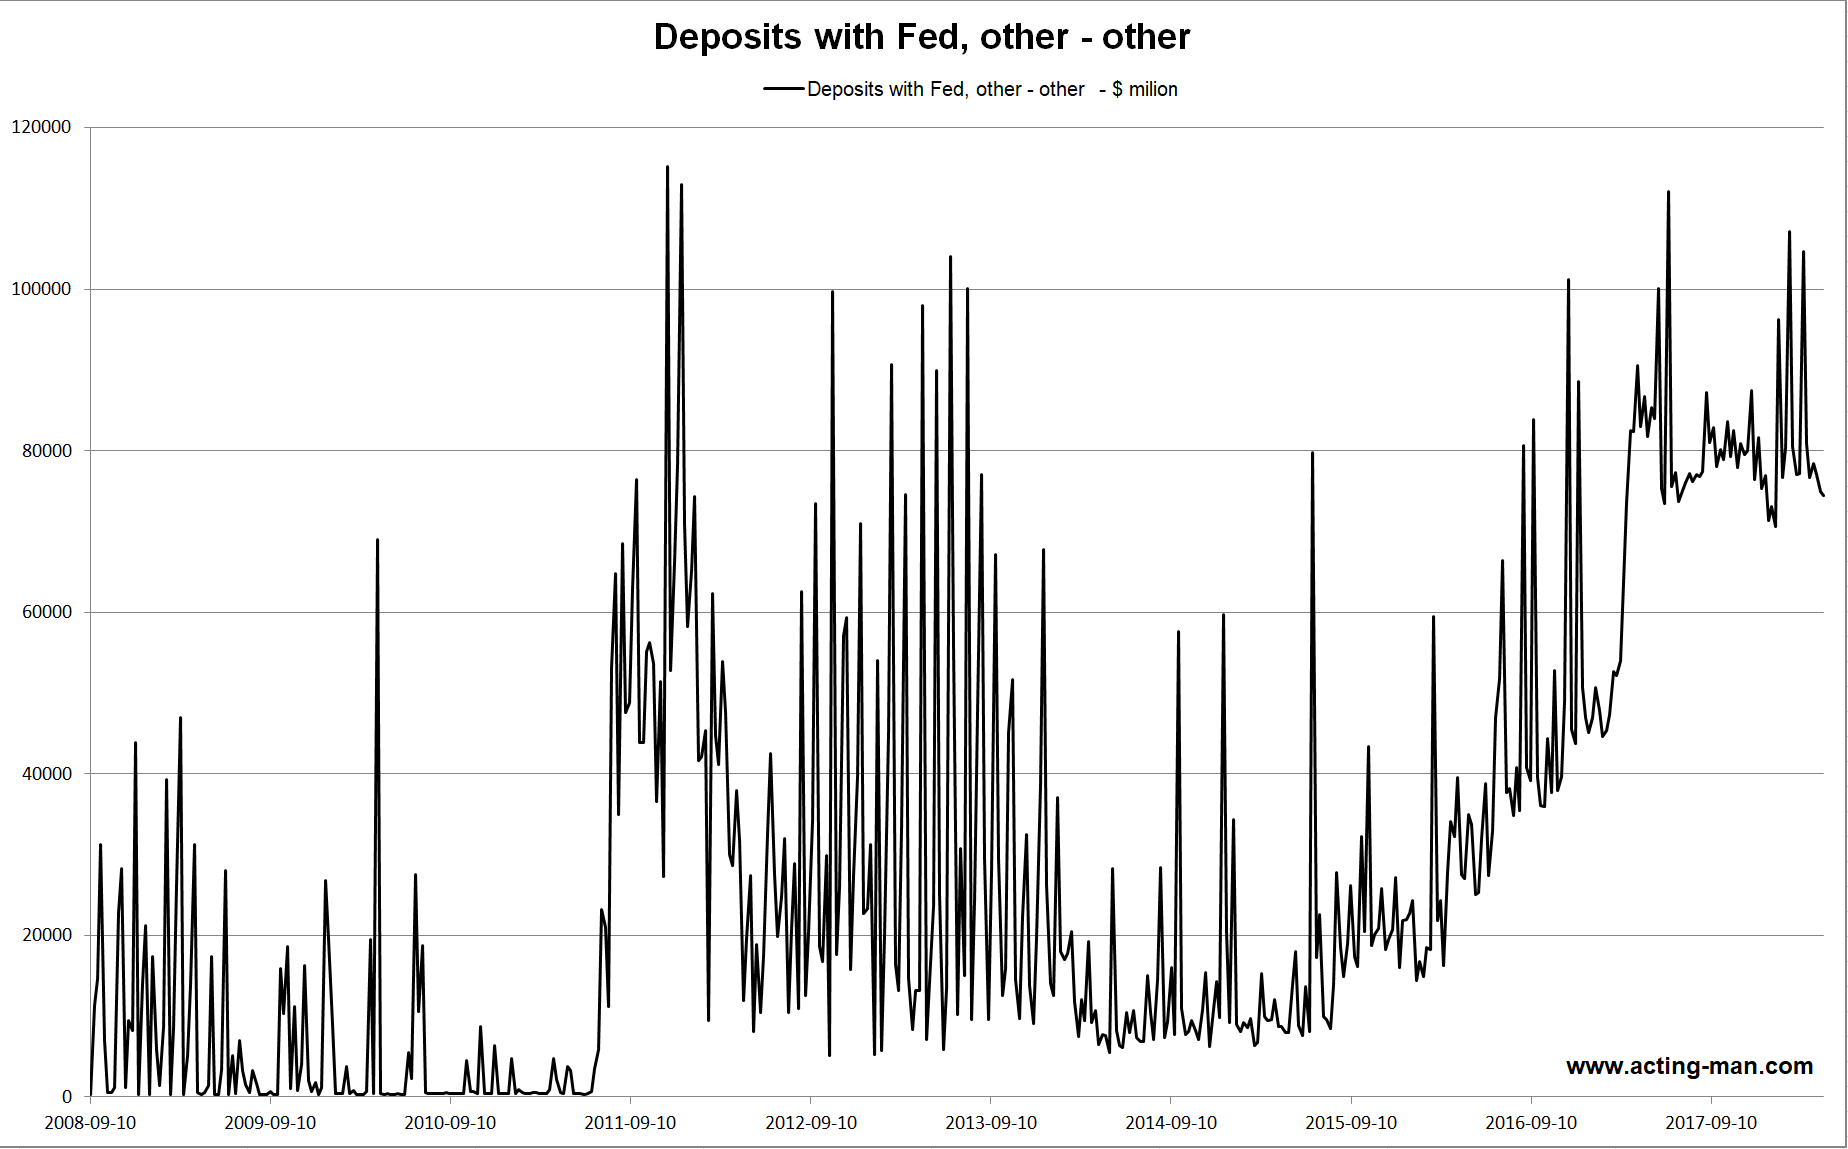 The double-plus-other money account, which mainly holds balances of the GSEs. - Click to enlarge |
ConclusionIt remains to be seen how these recent trends evolve in coming months. Both LIBOR and the amount deposited in the Treasury’s general account have continued to rise at latest count, a hint that repatriation flows are still underway. We suspect these are partly responsible for the bid in the stock market in recent months (as cash-rich companies have increased their share buybacks). Nevertheless, the lagged effects of the slowdown in money supply growth into the February low have yet to play out in full. We also suspect that QT – which is programmed to increase to $40 billion per month in July – is eventually going to overwhelm the effects of both repatriation flows and weakish bank lending growth. Note that this is coupled with a slowdown in euro area TMS growth, which has recently begun to accelerate as well – as of March, the y/y growth rate has declined to below 7%, which is perfectly in line with our expectations and is the lowest level since late 2014 (our back-of-the-envelope calculation – given what we know about euro area bank credit growth – calls for a slowdown to around 4% this year). Addendum – EM Currency SlaughterAs a final thought, there have been rather stunning moves in several emerging market currencies recently – particularly the Argentine peso and the Turkish lira (we can probably forget about the Venezuelan bolivar by now– it seems no longer really usable as a medium of exchange). This typically happens when USD interest rates awaken from a prolonged slumber – it is testament to the interconnectedness of the global credit system. Keep in mind that European banks are huge players in US dollar-based lending, and one presumes they cannot be too happy about yet another repatriation wave hitting the euro-dollar market. Of course we are just guessing to some extent, but experience tells us that the recent moves in EM currencies are definitely tied to the rise in US rates and the growing plight of various financial intermediaries. Bonus Chart: Bolivar Black Market RateHere is a chart of the above mentioned Venezuelan currency – in both log and linear format. The log chart makes it possible to see the progression of the currency’s demise over time in greater detail, while the linear chart illustrates the hyper-inflationary nature of the collapse. As is typical in these situations, a very large proportion of the currency’s exchange value is disappearing in accelerating fashion over a time period of just a few months. Venezuela’s socialist-in-chief, Nicolas Maduro, has recently introduced a cryptocurrency called the petro, which is supposed to be “backed” with oil – which PDVSA is reportedly no longer even able to produce or deliver. Its production has been cut in half from its peak and moreover, it just “lost” a few important export and storage terminals in the Caribbean to irate creditors who have gone into confiscation mode. |
VEF/USD Black Market Rate, Jun 2010 - May 2018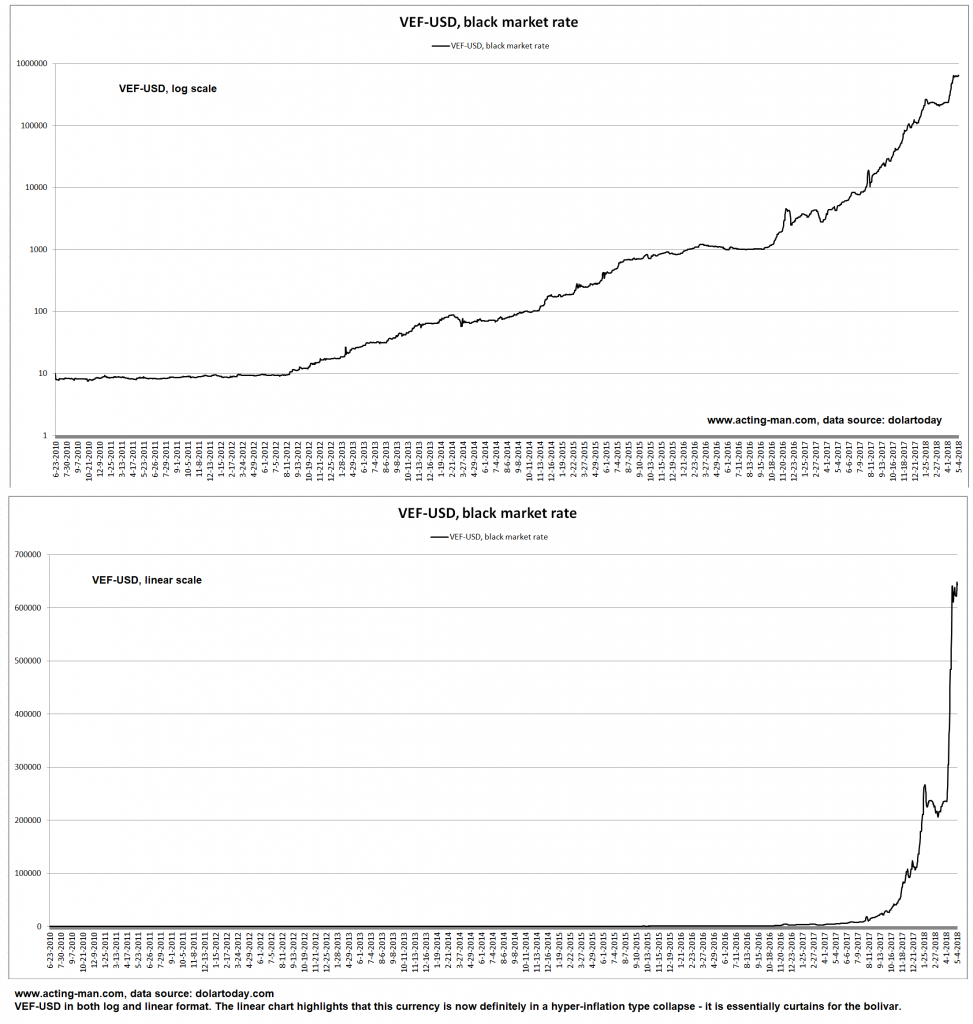 Adios bolivar! A wheelbarrow will no longer do the job – you need at least a truck. - Click to enlarge |
Tags: Chart Update,Credit Markets,Featured,newsletter,On Economy