Pater Tenebrarum
My articles My siteAbout meMy booksMy videos
Follow on:TwitterFacebook
Seeking Alpha
A “Typical” Correction? A Narrative Fail May Be in Store Obviously, assorted crash analogs have by now gone out of the window – we already noted that the market was late if it was to continue to mimic them, as the decline would have had to accelerate in the last week of March to remain in compliance with the “official time table”. Of course crashes are always very low probability events – but there are occasions when they have a higher probability than otherwise, and we will certainly point those out when we see them. Anyway, something else is evidently happening. Here is a chart of the SPX that shows the important trend-line which was so far successfully defended: S&P 500 Large Cap Index, Dec 2016 - Apr 2018(see
Topics:
Pater Tenebrarum considers the following as important: 8) Stock Markets, Chart Update, Featured, newsletter, The Stock Market, The United States
This could be interesting, too:
Vibhu Vikramaditya writes Navigating the Slippery Slope: How Hoover’s Interventions Paved the Way for the Great Depression
Ryan McMaken writes Frédéric Bastiat Was a Radical Opponent of War and Militarism
Douglas French writes Millennials: In Costco We Trust
Joseph T. Salerno writes What Fed “Independence” Really Means
A “Typical” Correction? A Narrative Fail May Be in StoreObviously, assorted crash analogs have by now gone out of the window – we already noted that the market was late if it was to continue to mimic them, as the decline would have had to accelerate in the last week of March to remain in compliance with the “official time table”. Of course crashes are always very low probability events – but there are occasions when they have a higher probability than otherwise, and we will certainly point those out when we see them. Anyway, something else is evidently happening. Here is a chart of the SPX that shows the important trend-line which was so far successfully defended: |
S&P 500 Large Cap Index, Dec 2016 - Apr 2018(see more posts on S&P 500 Index, )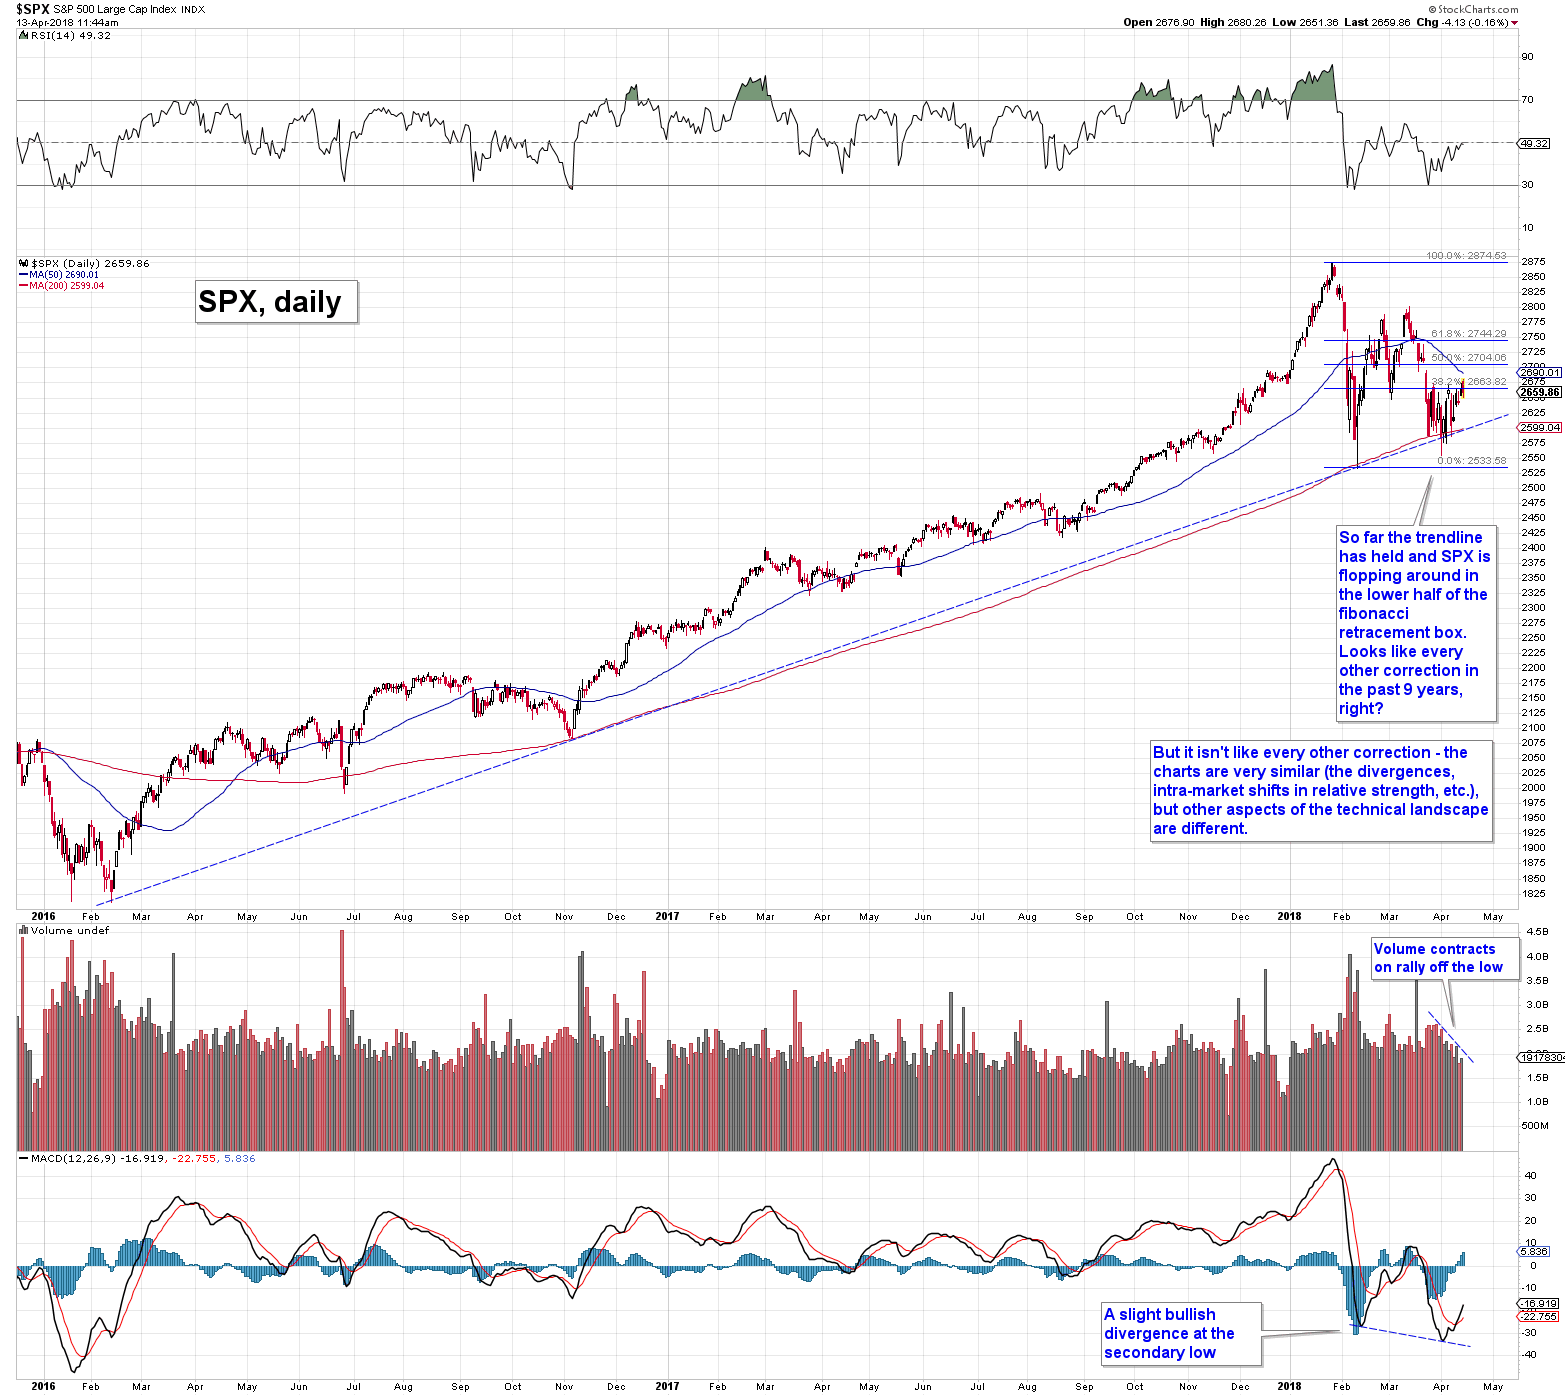 According to the “keep it simple” chart, this was just a run-of the mill correction, very similar to every other correction seen since the 2009 low. But is that really the case? - Click to enlarge |
| The rebound from the trend-line is accompanied by an over-arching narrative. We are not referring to the news items that are supposedly responsible for jerking the market this way and that on a day-to-day basis (these consist mainly of Trump tweets on trade and military interventions, which he seems to use as part of his negotiating strategy, and the responses of his opponents to the moves he makes in this Twitter war).
These explanations for market moves never make a lick of sense anyway: Donald Trump didn’t just become “unpredictable” this year. The Middle East didn’t turn into a proxy war battlefield brimming with betrayals and disinformation this week. The threat that trade barriers might be erected didn’t just fall unannounced from the sky either. It was a major part of Trump’s policies, frequently stressed during his campaign, reflecting views he has demonstrably held since at least the 1980s, if not longer. We are actually referring to something else, namely the upcoming earnings season. It is widely held that it will be business as usual, which is to say that nearly every important big cap index constituent will reliably manage to “beat expectations”, which will be followed by the usual gap-up moves into the blue yonder the day after. Hence it will be off to the races for the cap-weighted indexes again. Mind, superficially this isn’t even an unreasonable notion, given that it has worked umpteen times in recent years (i.e., basically every quarter – that’s how one can calculate the precise number represented by the variable “umpteen”). There may be a problem though this time – in order for expectations to be beat, one first has to have sufficiently low expectations. That becomes increasingly difficult as valuations expand, since the expansion in valuations by itself indicates that expectations are ratcheted up. There is an additional new wrinkle this time around that was apparently introduced by the tax cut. Wall Street earnings estimates have been wildly over-optimistic year after year, but this has now become insanely over-optimistic. Here is a Bloomberg chart illustrating the jump in 2018 estimates. Bloomberg’s chart keepers noticed that analysts upped their estimates sharply just before the beginning of the last bear market. We are actually not saying that just because something happened last time, it should happen again this time. We are mainly focused on the size of the jump in estimates this year, which is unprecedented as far as we know. In other words, this is an excellent set-up for disappointment, which may well end up derailing the above-mentioned narrative. Will it happen this quarter already? We cannot be certain, but we certainly do know that the divergent DJIA-NDX peaks in January to March and the accompanying record overbought and bullish sentiment readings would make suitable material for a long term market peak that will not be seen again for many years. |
S&P 500 and Estimated EPS, 1991 - 2018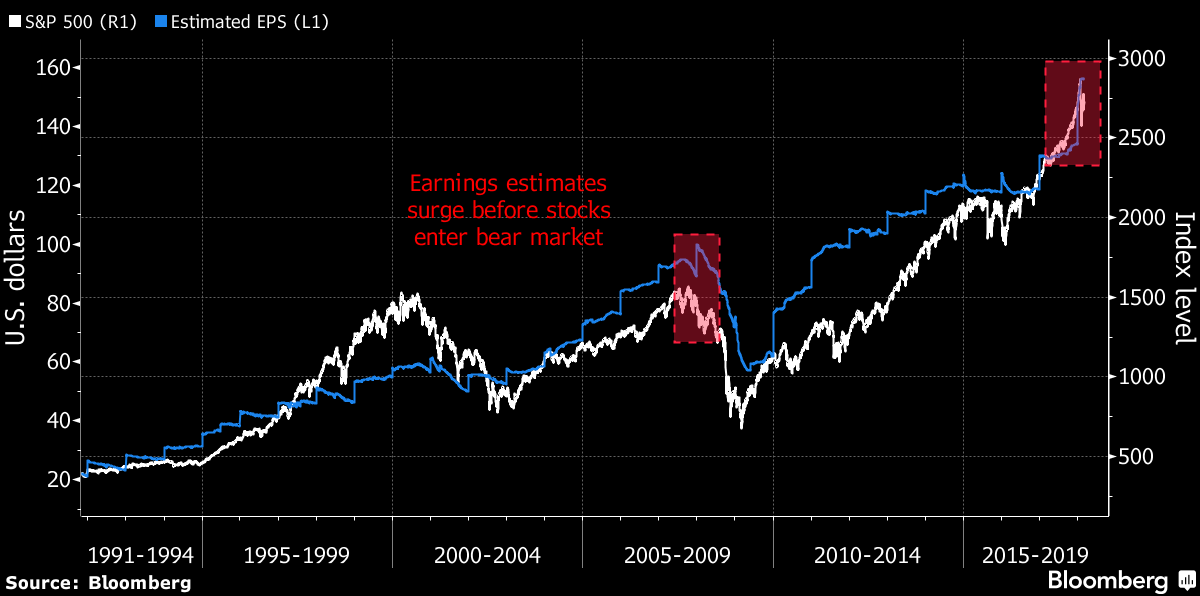 Wall Street earnings estimates and the SPX – the annotations above are by Bloomberg. - Click to enlarge We actually wanted to point to a specific aspect of the chart: namely the sheer size of the most recent jump in estimates, which is probably the biggest surge in earnings estimates ever. |
GBEB Death Watch Continues – Meet the Fear-Stricken GrizzliesWhat about the various indicators we focus on? The SPX NH-NL percentage index currently stands at +2, which is no longer a “sell”, but not really an all clear either – at best we would call it neutral. The important thing in this context remains that it never even came close to getting oversold, which it did in every other major correction (particularly in 2011, 2015 and early 2016, which are the only comparable corrections since the 2009 low in terms of speed and size). It is one of the things that makes us think we should not believe in the most recent turnaround just yet. |
S&P 500 New Highs - New Lows Percent, Feb 2010 - Apr 2018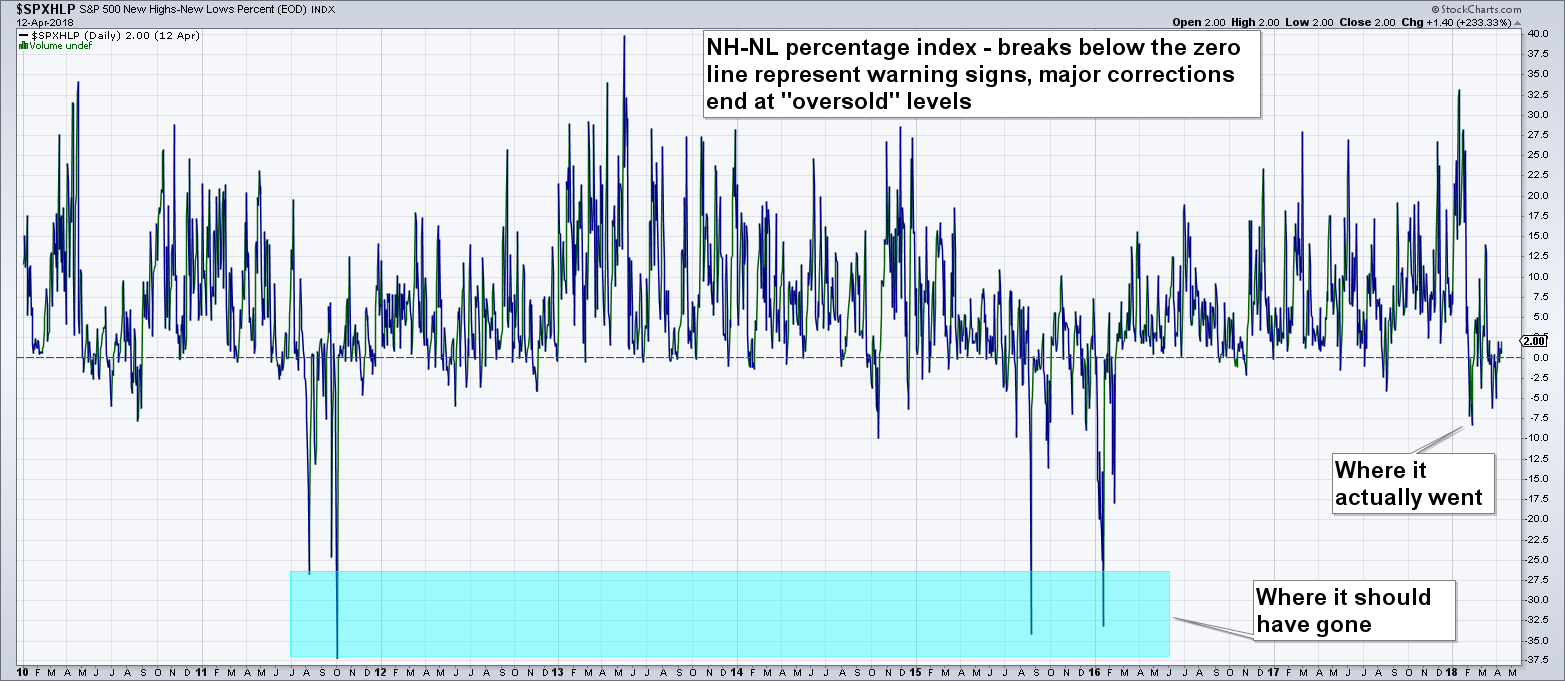 SPX NH-NL percentage index – it never became oversold - Click to enlarge |
| The relative strength of Russell 2000 (a result of intra-market rotation) currently looks medium term market-positive, but we are focused on its directional changes in the short term. It gave a short term positive signal at the end of last week and again on Monday, when the market closed right on the trend-line discussed above, but has just issued another short term negative signal again. It continues to work well as a short term indicator (positive when it is up on a down day, negative when it is down on an up day).
What continues to strike us as astonishing in light of the sharp increase in day-to-day volatility is the nonchalance of option traders and the by now almost comical fear of bears that they will get mauled again. The fifteen remaining bears (we probably know most of them personally) seem to be the only group of traders in this market that is genuinely worried. Mind, we are not talking about people who say they are bearish. We are talking about people who are actually betting on a decline in prices with their money. Here is an update of the CBOE equity put-call volume ratio. All previous corrections since 2009 – both major and minor ones – generated a modicum of fear, a scrambling for hedges and some downside speculation. In 2018 option traders behaved as though absolutely nothing was happening: |
CBOE Options Equity Pubcall Ratio, May 2013 - Apr 2018 In early February the ratio came close to “fear territory”, but fell again before actually getting there. - Click to enlarge |
| While we see the action in options more as a sign of bullish overconfidence, Rydex asset levels are mainly indicative of bearish fear and complacency. Amazingly, Rydex bear assets simply failed to get off the mat even in the slightest in the recent correction – a sign that many holders used the minor bounce in bearish funds as an opportunity to get out of their positions. They have never been comparably demoralized in the entire history of these funds (note: despite the small amount of AUM, this fund family continues to provide a representative snapshot of overall market sentiment). |
Total Assets Rydex Moneymarket, 2003 - 2018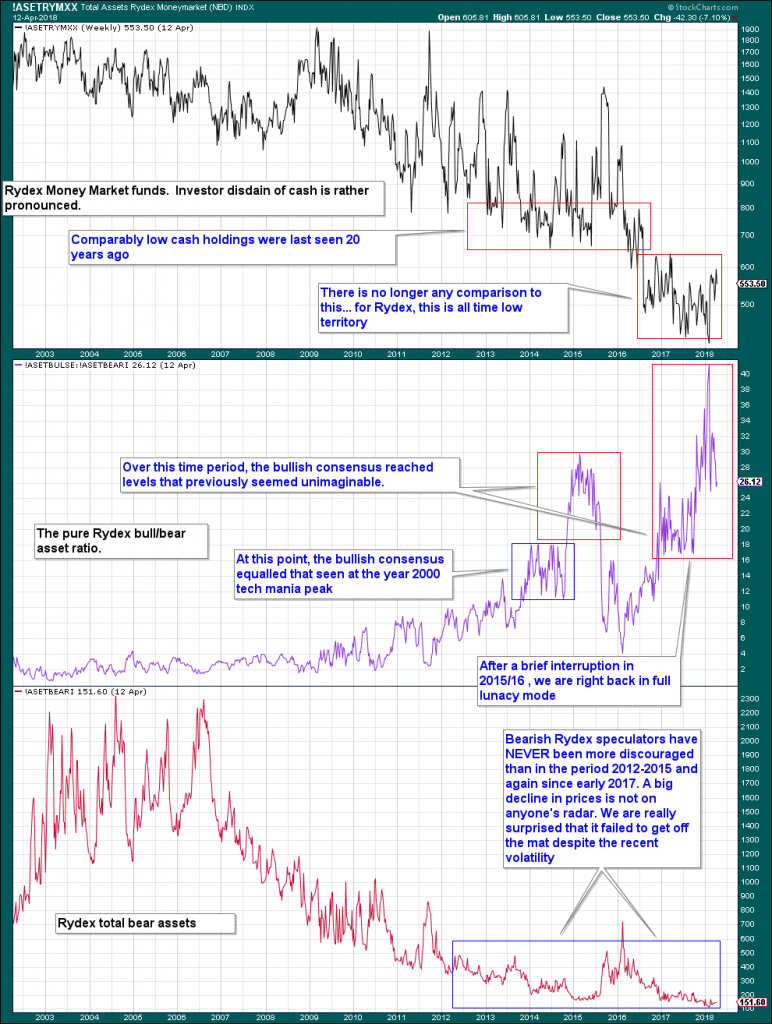 The pure Rydex bull-bear ratio remaining at a level of over 26 after the recent shakeout is best adjectivized with “insane”, but we find the level of bear assets even more impressive as signals go. - Click to enlarge It is not even a hair above the all time low of late January. Clearly, bears are the only group of traders that is actually scared. We are not sure what to compare this to, it simply has never happened to this extent in comparable situations. If one looks at the 2006-2007 time period, back then they massively reduced their exposure at just the wrong moment after first increasing it at the wrong moment in 2002-2003. When the crash finally arrived in 2008, they had already cut their exposure by more than 60%, so their recent reluctance to push their bets should actually worry bulls greatly. |
| Sentimentrader publishes a variant of the Rydex ratio that focuses exclusively on SPX and NDX funds. It shows bull fund allocations as a percentage of total bull and bear fund allocations. It is not just in “excessive optimism” territory, it has in the meantime crossed over into the Negative Zone and is reportedly searching for the recently disappeared Mr. Fantastic. |
SPX and Rydex Ratio, Jan 2012 - Apr 2018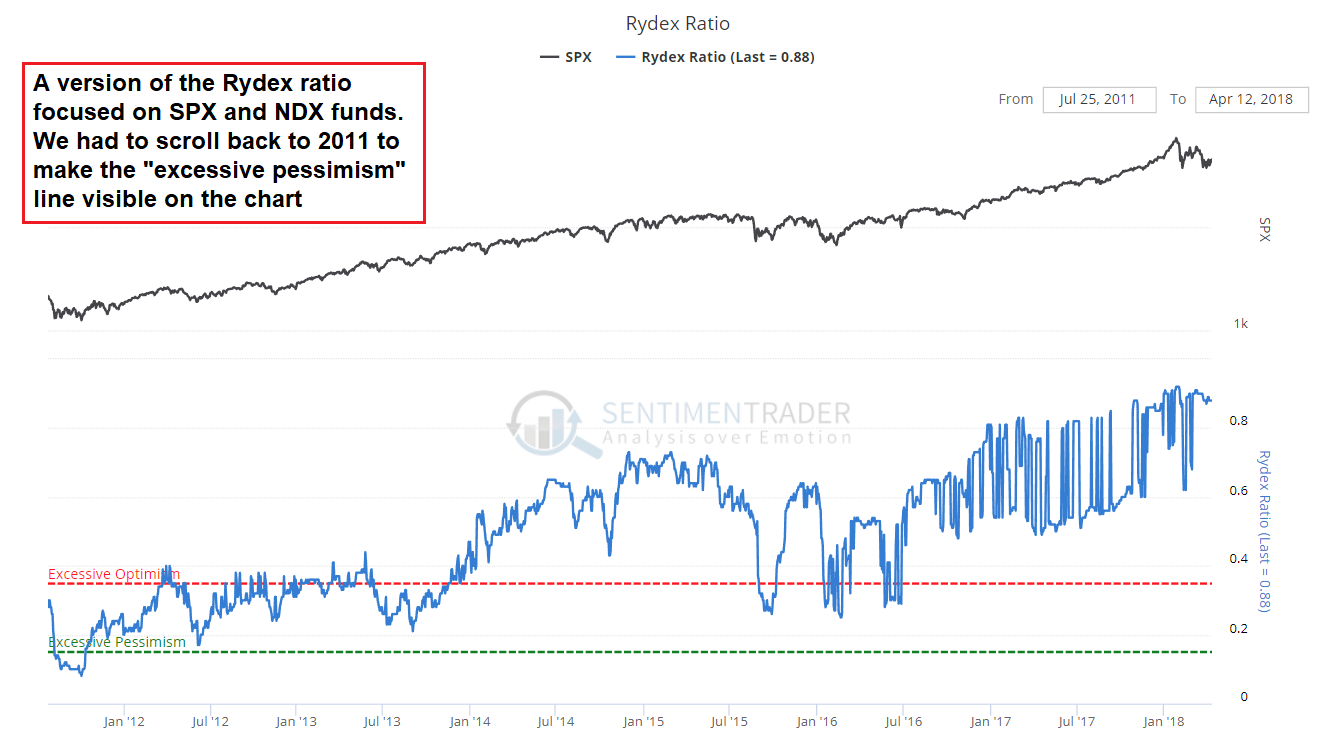 After initially responding to the sell-off, this SPX-NDX focused Rydex ratio is right back near its all time high. - Click to enlarge |
| Or of you’re more of a Batman person, it is now in Arkham Asylum to prove to the Joker that there are things out there in this world that are actually crazier than he is. |
 Bears in 2018: they’re not what they used to be. - Click to enlarge |
SMI PlungeReaders are probably aware of the so-called “smart money” index. The theory behind the index holds that the “dumb money” primarily trades early in the trading day, while the “smart money” makes decisions close to the end of the trading day. Rallies early in the day (first half hour) are accordingly given a negative value, and so are late day (last half hour) sell-offs. The opposite actions are given positive values, and at the end of each trading day they are summed up and the result is charted. Here is what the chart looks like at the moment: We are not really sure whether the theory behind the SMI is really sound, but we cannot deny its pronounced counter-cyclical trends, which suggest that the “buy low-sell high” faction really does dominate trading late in the day. We would note that there has never been a comparably sharp and swift collapse in the SMI than the one that started in late 2017, in parallel with the final blow-off move in the market. It has not reversed on account of the downturn after January 26, which contrasts with what happened in August 2015. ConclusionIt looks as though it’s not the bears who should be scared. |
Smart Money Index, 2000 - 2018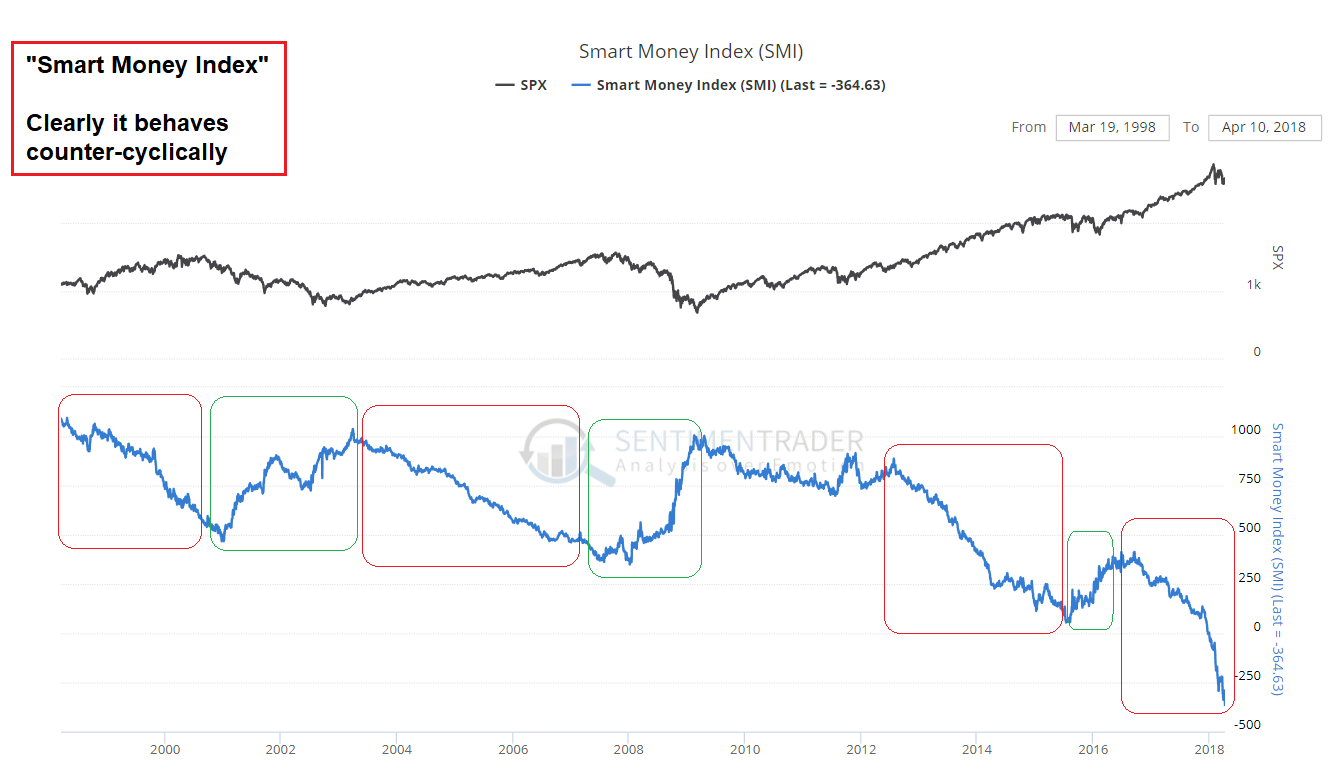 The SMI displays well-developed counter-cyclical behavior. - Click to enlarge Recently the rise from the August 2015 mini-crash low to the US presidential election and the subsequent – lately accelerating – collapse were quite noteworthy. |
Tags: Chart Update,Featured,newsletter,The Stock Market