See the introduction and the video for the terms gold basis, co-basis, backwardation and contango. The Lighthouse Moves Picture, if you will, a brick slowly falling off a cliff. The brick is printed with green ink, and engraved on it are the words “Federal Reserve Note” (FRN). A camera is mounted to the brick. The camera shows lots of things moving up. The cliff face is whizzing upwards at a blur. A black painted brick labeled “oil” is going up pretty fast, but not so fast as the cliff face. It is up 26% in a year. A special brick, a government data brick of sorts, labeled “CPI-U” has been going up ever so slowly. At least according to the camera on the FRN brick. In this surreal vertical landscape-in-motion, the
Topics:
Keith Weiner considers the following as important: Chart Update, dollar price, Featured, Gold and its price, gold basis, Gold co-basis, gold prices, gold silver ratio, newslettersent, Precious Metals, silver basis, Silver co-basis, silver prices, U.S. Consumer Price index
This could be interesting, too:
Vibhu Vikramaditya writes Navigating the Slippery Slope: How Hoover’s Interventions Paved the Way for the Great Depression
Ryan McMaken writes Frédéric Bastiat Was a Radical Opponent of War and Militarism
Douglas French writes Millennials: In Costco We Trust
Joseph T. Salerno writes What Fed “Independence” Really Means
See the introduction and the video for the terms gold basis, co-basis, backwardation and contango.
The Lighthouse MovesPicture, if you will, a brick slowly falling off a cliff. The brick is printed with green ink, and engraved on it are the words “Federal Reserve Note” (FRN). A camera is mounted to the brick. The camera shows lots of things moving up. The cliff face is whizzing upwards at a blur. A black painted brick labeled “oil” is going up pretty fast, but not so fast as the cliff face. It is up 26% in a year. A special brick, a government data brick of sorts, labeled “CPI-U” has been going up ever so slowly. At least according to the camera on the FRN brick. In this surreal vertical landscape-in-motion, the lighthouse across the water, labeled gold, went up $13 this week. Amazing, these GoPro cameras, able to capture such a thing while falling off a cliff attached to a brick… The silver streamer tied to the gold lighthouse went up 24 cents. If the CPI-U is to be believed, the purchasing power of the dollar went down slightly. So that means the purchasing power of your gold went up slightly more than slightly and the purchasing power of your silver went up slightly more than that. |
US Consumer Price Index, Jan 2003 - 2018(see more posts on U.S. Consumer Price Index, )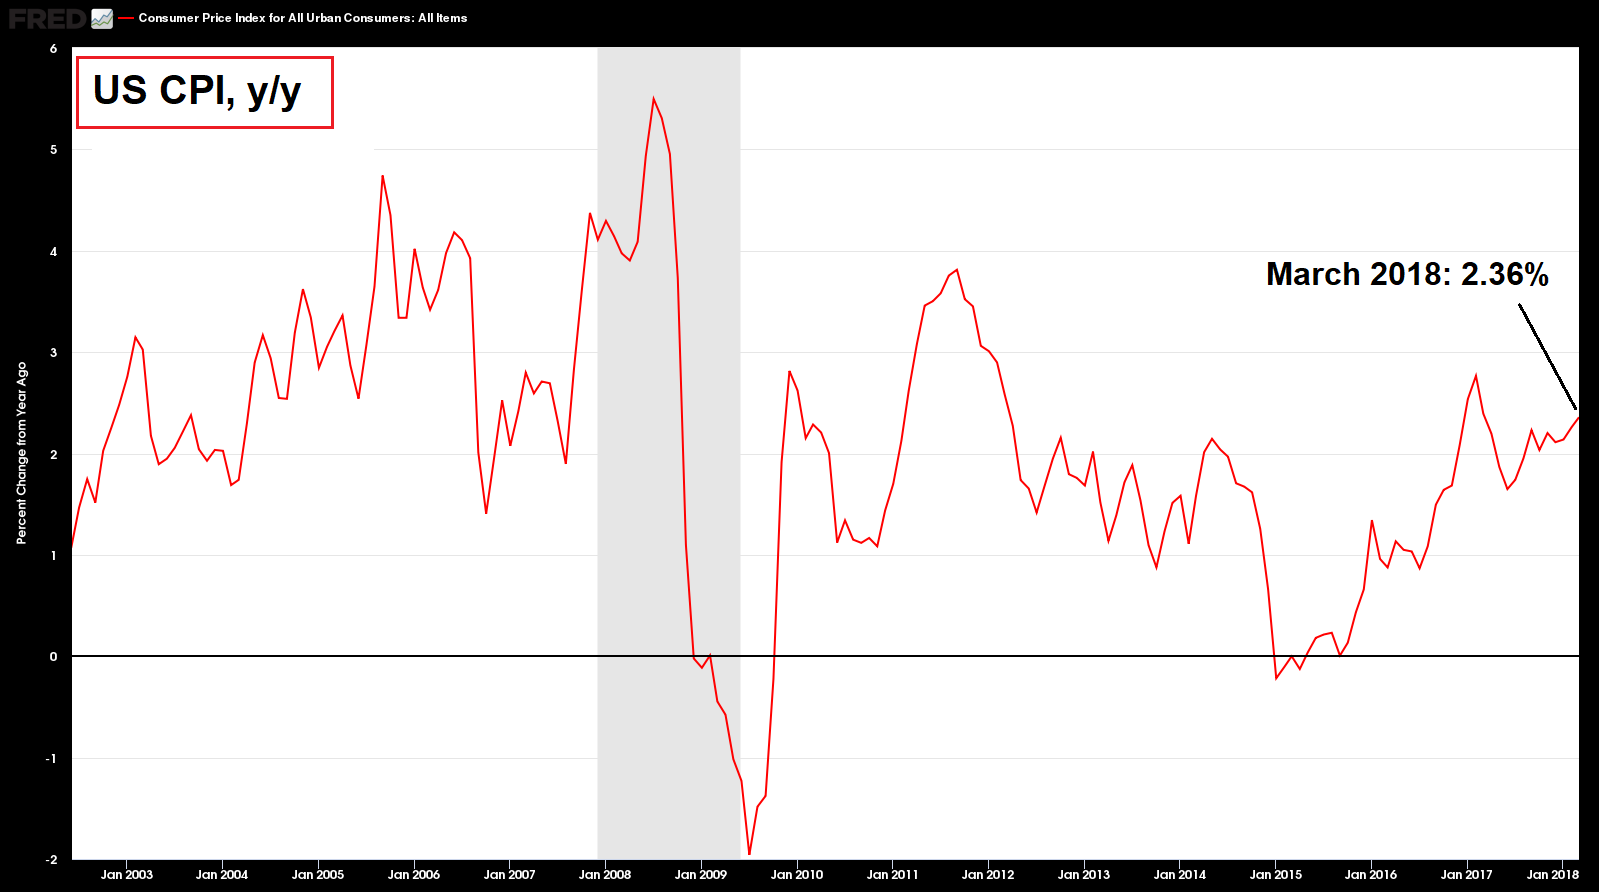 - Click to enlarge |
Fundamental Developments – Gold Scarcity Continues to IncreaseIf this continues, it promises to be a great trip… but will it? We will look at that. But first, here is the chart of the prices of gold and silver. |
Gold and Silver Prices(see more posts on Gold prices, silver prices, )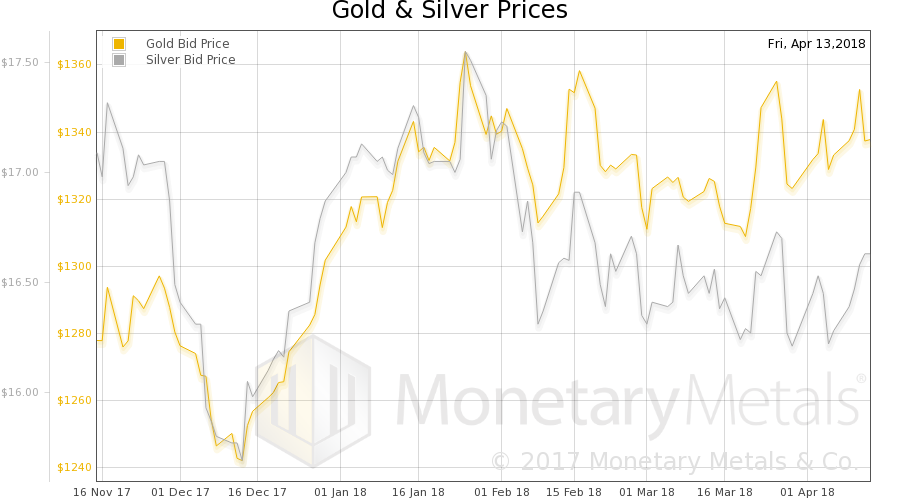 Gold and silver priced in USD - Click to enlarge |
| Next, this is a graph of the gold price measured in silver, otherwise known as the gold to silver ratio (see here for an explanation of bid and offer prices for the ratio). It fell slightly this week, i.e., silver went up objectively, in gold terms. |
Gold:Silver Ratio(see more posts on gold silver ratio, )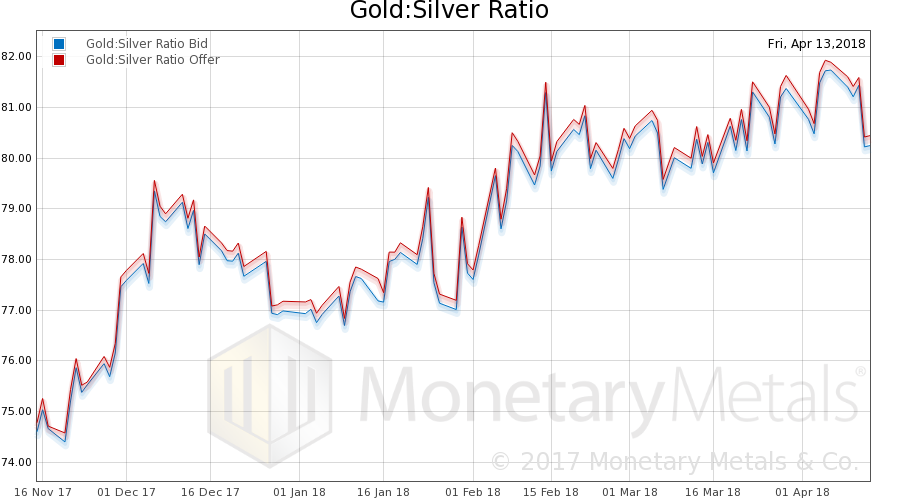 Gold-silver ratio, bid and offer - Click to enlarge |
| Here is the gold graph showing gold basis, co-basis and the price of the dollar in terms of gold price. |
Gold Basis, Co-basis and the Dollar Price(see more posts on dollar price, gold basis, Gold co-basis, ) Gold basis, co-basis and the USD priced in milligrams of gold - Click to enlarge |
| We see a non-speculative, i.e., fundamental move occurring here, particularly since around March 20. The FRN brick has been falling as seen from the gold lighthouse (OK, this is the inverse of the rising price of gold measured in dollars).
Yet gold’s scarcity in the market has been rising in the face of this. The typical pattern when speculators are driving the market is that gold scarcity moves with the dollar price. As the dollar rises (i.e., the price of gold falls) gold becomes more scarce. As the dollar falls, gold becomes more abundant. Not at the moment. So it should not be a surprise that the Monetary Metals Gold Fundamental Price rose a further $16 this week (now over $1,500). Now let’s look at silver. It is a bit different in silver. The scarcity of this metal fell a bit. |
Silver Basis, Co-basis and the Dollar Price(see more posts on dollar price, silver basis, Silver co-basis, )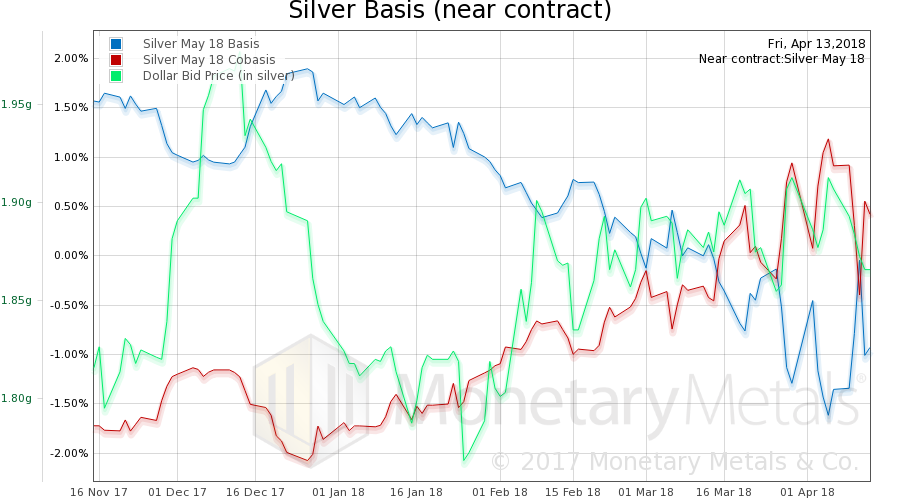 Silver basis and co-basis, and the USD priced in grams of silver - Click to enlarge |
However, the Monetary Metals Silver Fundamental Price rose 36 cents to $17.46. The fundamental price is now back where it had been in the third week of March.
Unlike in gold, there is no rising trend for the silver fundamental price. It’s been sideways action since September last year, and arguably in a downtrend making lower highs since February 2017.
© 2018 Monetary Metals
Charts by St. Louis Fed, Monetary Metals
Chart and image captions by PT
Tags: Chart Update,dollar price,Featured,gold basis,Gold co-basis,Gold prices,gold silver ratio,newslettersent,Precious Metals,silver basis,Silver co-basis,silver prices,U.S. Consumer Price Index