See the introduction and the video for the terms gold basis, co-basis, backwardation and contango. Gold Lending and Arbitrage There was no rise in the purchasing power of gold this week. The price of gold fell , and that of silver %excerpt%.19. One question that comes up is why is the fundamental price so far above the market price? Starting in January, the fundamental price began to move up sharply, and the move sustained through the end of April. London Interbank Offered Rate, Jun 2015 - 20181-month LIBOR (London Interbank Offered Rate – the rate at which banks lend euro-dollars to each other). LIBOR and GOFO determine the gold lease rate, which is indirectly reflected in gold futures prices along the curve as
Topics:
Keith Weiner considers the following as important: 6) Gold and Austrian Economics, dollar price, Featured, gold basis, Gold co-basis, gold price, gold silver ratio, newsletter, Precious Metals, silver basis, Silver co-basis, silver price
This could be interesting, too:
Vibhu Vikramaditya writes Navigating the Slippery Slope: How Hoover’s Interventions Paved the Way for the Great Depression
Ryan McMaken writes Frédéric Bastiat Was a Radical Opponent of War and Militarism
Douglas French writes Millennials: In Costco We Trust
Joseph T. Salerno writes What Fed “Independence” Really Means
See the introduction and the video for the terms gold basis, co-basis, backwardation and contango.
Gold Lending and ArbitrageThere was no rise in the purchasing power of gold this week. The price of gold fell $22, and that of silver $0.19. One question that comes up is why is the fundamental price so far above the market price? Starting in January, the fundamental price began to move up sharply, and the move sustained through the end of April. |
London Interbank Offered Rate, Jun 2015 - 2018 1-month LIBOR (London Interbank Offered Rate – the rate at which banks lend euro-dollars to each other). LIBOR and GOFO determine the gold lease rate, which is indirectly reflected in gold futures prices along the curve as well. - Click to enlarge |
The market price moved up $52 through January 25, but it did not move further. After the market price peaked, the fundamental price moved up an additional $168. Why?
It would be facile to say the co-basis moved up. Yes, the near contract co-basis rose from -1.87% to -1.61% (though the gold basis continuous did not). So what’s going on?
Consider the gold lease rate. We calculate this in the traditional way, except we use the futures market which is transparent, as opposed to the forward market. The gold lease rate GLR = LIBOR – GOFO. This is how dollar-based financial institutions such as bullion banks look at it (not to be confused with the rate on Monetary Metals direct leasing of metal).
This calculation determines the hypothetical “zero arbitrage” point, where the marginal arbitrageur is willing to earn nothing to borrow dollars at LIBOR, buy gold, selling it forward, and lease it for the duration. The absolute level of the lease rate is not important to this discussion. What matters is the change.
From Jan 25 to April 26, the 6-month gold lease rate more than doubled, from 0.25% to 0.56%. A rising lease rate indicates a rising scarcity of the metal. It should intuitively make sense. But let’s drill down into the specifics of what is called “gold leasing”.
It is an unnatural process, an artifact of declaring money (gold) to be a commodity, while forcing non-money (the dollar) to be used as if it were money. In a free market, there would be no leasing market in money. It would be an interest rate market, aka the gold bond market.
But there isn’t a free market in money and credit. There is an imposed regime of the dollar. So to lease gold, a bank begins by borrowing dollars to buy gold to lease out. However, this creates a risk. What happens if the price of gold drops? So the bank must hedge. It sells a futures contract.
We note that the would-be gold lessor has an expense, namely LIBOR (and likely a spread above this benchmark). And it has a variable, which may be either revenue or expense, depending on market conditions. That is, the spread between future and spot. GOFO is a close cousin of the basis.
Leasing is a gold carry trade plus a credit transaction. The carry trade makes more as the spread between spot and futures rises. It makes less, as the cost of borrowing goes up. The lease rate is calculated to so these net to zero (LIBOR – GOFO – GLR = 0).
So why does a rising lease rate indicate rising scarcity? We first note something that is true in all markets. A high price discourages utilization. Without knowing why, we know if the price is rising then the good is less available and a smaller quantity will be purchased.
In the case of gold, the elephant in the room is rising LIBOR. 6-month LIBOR began the year at 1.84%. However, by April 26, it had jumped up to 2.52%. However, there was no corresponding leap in GOFO.
The cost of carry increased, but the revenue of carry did not. This is a picture of robust demand for the physical metal, relative to demand for futures. And you can see it in the open interest in gold futures, which peaked in late January and hit a low on May 9.
Fundamental DevelopmentsHere is the chart of the prices of gold and silver. |
Gold and Silver Prices(see more posts on gold price, silver price, )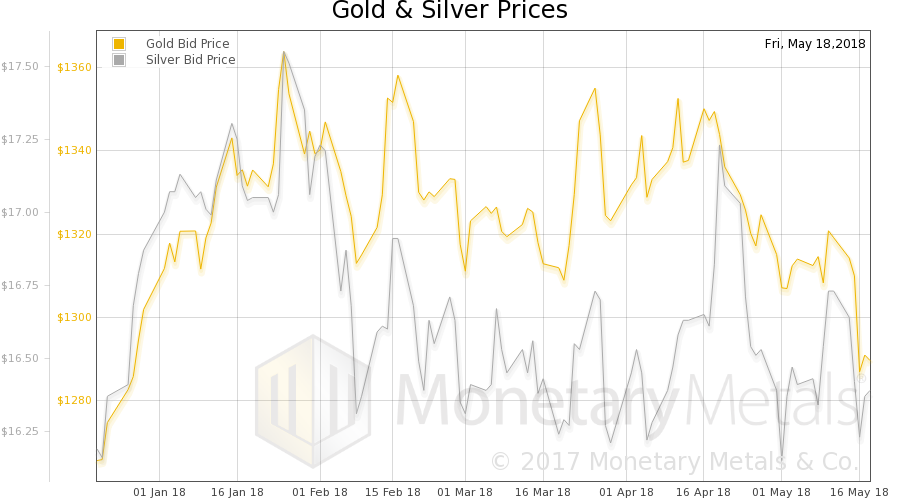 Gold and silver priced in USD - Click to enlarge |
| Next, this is a graph of the gold price measured in silver, otherwise known as the gold to silver ratio (see here for an explanation of bid and offer prices for the ratio). It fell a bit this week. |
Gold:Silver Ratio(see more posts on gold silver ratio, )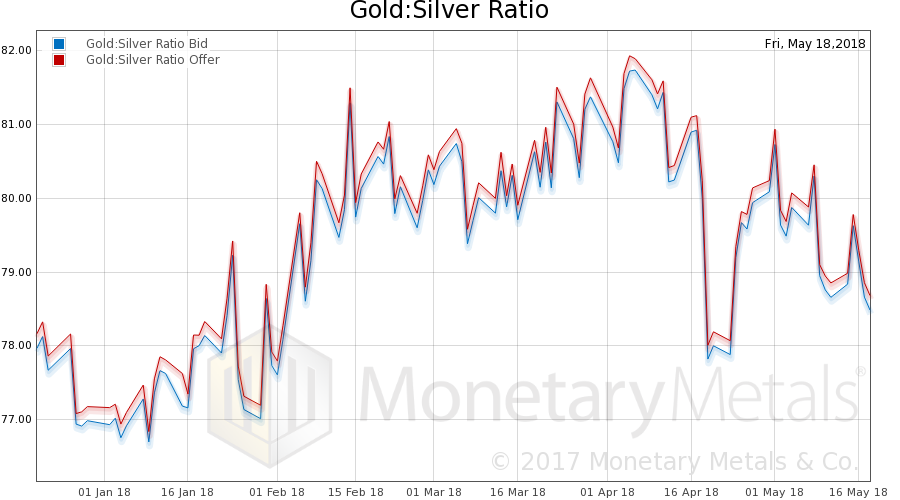 Gold-silver ratio, bid and offer - Click to enlarge |
| Here is the gold graph showing gold basis, co-basis and the price of the dollar in terms of gold price. |
Gold Basis and Co-basis and the Dollar price(see more posts on dollar price, gold basis, Gold co-basis, )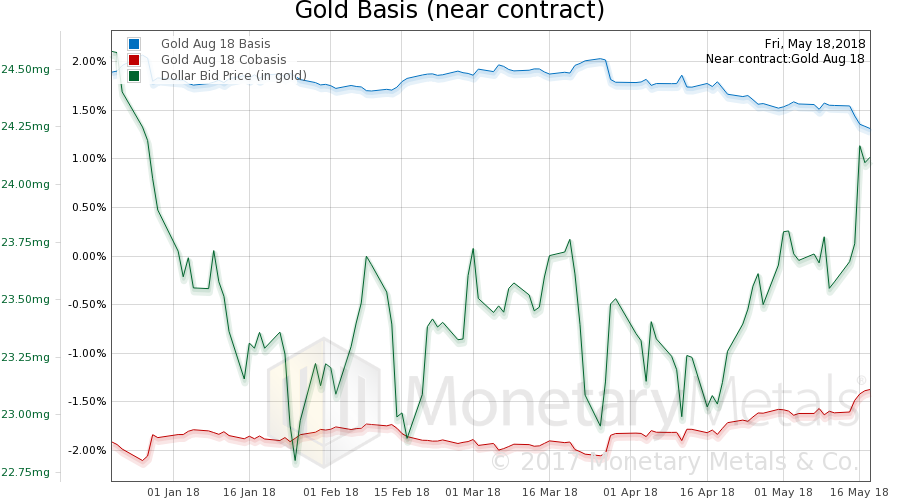 Gold basis, co-basis and the USD priced in milligrams of gold - Click to enlarge |
| The August co-basis rose a bit this week, though not commensurately with the falling price. The gold continuous co-basis did not. The Monetary Metals Gold Fundamental Price fell $71 this week to $1,422.
Now let’s look at silver. The price of silver fell less in proportion. And the near silver co-basis rose more (and silver continuous basis rose too). |
Silver Basis and Co-basis and the Dollar Price(see more posts on dollar price, silver basis, Silver co-basis, )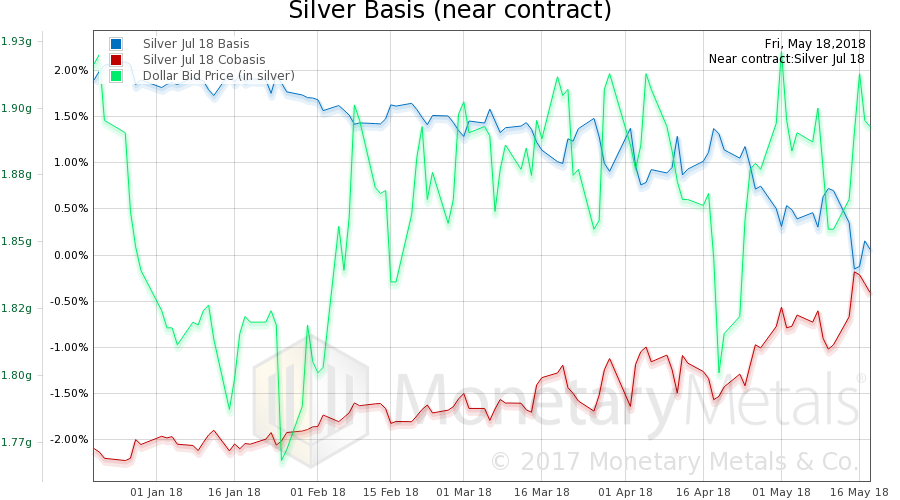 Silver basis, co-basis and the USD priced in grams of silver - Click to enlarge |
So contrary to gold, the Monetary Metals Silver Fundamental Price rose 32 cents to $17.92. This brings the Monetary Metals Gold:Silver Ratio Fundamental down from around 84 to 79.
© 2018 Monetary Metals
Charts by: StockCharts, Monetary Metals
Chart and image captions by PT
Tags: dollar price,Featured,gold basis,Gold co-basis,gold price,gold silver ratio,newsletter,Precious Metals,silver basis,Silver co-basis,silver price