Friday , April 19 2024
Home / Dimitri Speck
Dimitri Speck

Dimitri Speck

Dimitri Speck specializes in pattern recognition and trading systems development. He publishes the website www.SeasonalCharts.com, which features free-of-charge seasonal charts for interested investors. In his book The Gold Cartel (see link on the right hand side), commodities expert Dimitri Speck discusses gold price manipulation and modern-day credit excess. His commodities trading strategy Stay-C has won awards all over Europe. He is the publisher of the web site Seasonal Charts as well as of the Bloomberg app Seasonax.

Articles by Dimitri Speck

An Excellent Seasonal Buying Opportunity in Silver Lies Directly Ahead

June 28, 2020

Gold’s Little Brother
Today I want to put a popular precious metal under the magnifying glass for you: silver.
Silver, often referred to as the “little brother” of gold, has a particularly interesting seasonal pattern I would like to share with you.

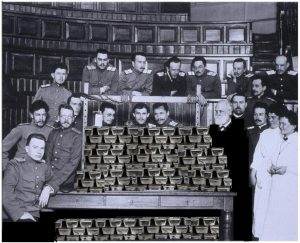
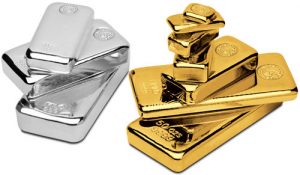
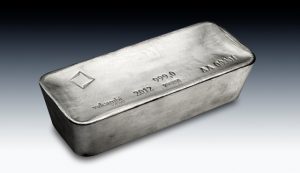
Shiny large good delivery door stops made of silver – about to enter interesting seasonal phase. PT

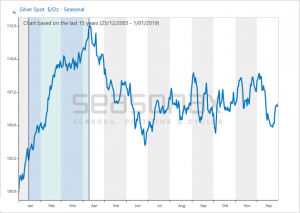
Silver’s seasonality under the magnifying glass
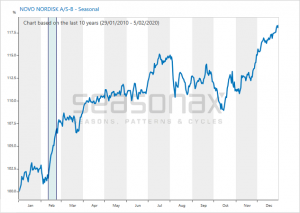
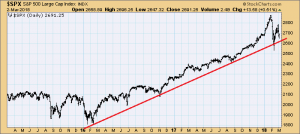
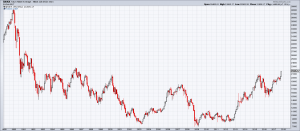
Take a look at the seasonal chart of silver. In contrast to a standard price chart, the seasonal chart shows the average pattern of silver in the course of a calendar year. For this purpose, an average was calculated from the price patterns of the past 52 years. The horizontal axis shows the time of the year, the vertical axis depicts price information.
As the chart

Read More »

A Pharmaceutical Stock That Is Often Particularly Strong At This Time Of The Year

February 15, 2020

An Example of Strong Single Stock Seasonality
Many individual stocks exhibits phases of seasonal strength. Being invested in these phases is therefore an especially promising strategy.
Today I want to introduce you to a stock that tends to advance particularly strongly at this time of the year: Novo Nordisk. The Danish pharmaceutical group supplies a broad range of products and is a global market leader in diabetes drugs.

Danish drug company Novo Nordisk

Novo Nordisk exhibits a brief, but very strong seasonal phase
Take a look at the seasonal chart of Novo Nordisk below. This is not a standard price chart showing prices moves over a specific time period. Rather, the seasonal chart depicts the average price pattern of Novo Nordisk in the course of a calendar

Read More »

The Strongest Seasonal Advance in Precious Metals Begins Now

December 20, 2019

Plans and Consequences
You are probably already getting into the holiday spirit, perhaps you are even under a little stress. But the turn of the year will soon be here – an occasion to review the past year and make plans for the new one. Many people are doing just that – and their behavior is creating the strongest seasonal rally in the precious metals markets.

Anonymous industrial stackers showing off their freshly purchased silver hoard. PT

Silver is seasonally cheap in mid December
First let us look at the seasonal chart of silver.
The chart shows the average moves in silver prices in the course of a calendar year over the past 69 years. The horizontal axis shows the time of the year, the vertical axis depicts price information.
With the help of this chart,

Read More »

The Golden Autumn Season – One of the Most Reliable Seasonal Patterns Begins

October 29, 2019

The Strongest Seasonal Stock Market Trend
Readers may already have guessed: when the vibrant colors of the autumn leaves are revealed in all their splendor, the strongest seasonal period of the year begins in the stock market – namely the year-end rally.
Stocks typically rise in this time period. However, there are questions, such as: how often does a rally take place, how strong is it, and when is the best time for investors to enter the market?
I will answer these questions for you below.

Will Santa wake up this year? Last year he was clearly missing in action – but that is actually the exception, not the rule PT

The “Golden Season” in the S&P 500 Index Begins Now!
The first illustration below represents a seasonal chart of the S&P 500 Index. The chart was

Read More »

A Gain of 1,080 percent Annualized – One of the Strongest Seasonal Rallies is Starting Right Now

October 16, 2019

Bitcoin – An Exceptional Asset
When I first heard about Bitcoin (BTC) in May 2011, it was trading at 8 US dollars. Today, more than eight years later, BTC trades at around 8,000 dollars. A thousandfold increase! An investment of 1,000 dollars at the time would have resulted in a gain of more than a million  –  a dream result.
However, even an exceptional asset such as Bitcoin has its ups and downs – inter alia in terms of its seasonal patterns.
And an exceptional seasonal trend lies directly ahead.

Bitcoin went from 10,000 BTC for a pizza to around 100 BTC for a Lambo in what appeared to be an unseemly hurry… PT

The Precise Annual Seasonal Pattern of Bitcoin
Let us take a close look at the seasonal pattern of Bitcoin.
The chart below shows the typical price

Read More »

Scientific Long-Term Study Confirms: Seasonality is the Best Investment Strategy!

July 23, 2019

A Pleasant Surprise
You can probably imagine that I am convinced of the merits of seasonality. However, even I was surprised that an investment strategy based on seasonality is apparently leaving numerous far more popular strategies in the dust. And yet, this is exactly what a recent comprehensive scientific study asserts – a study that probably considers a longer time span than most: it examines up to 217 years of market history!
Why is the length of the time period reviewed in the study so important? If you compare investment strategies as a practitioner, you may well look at just the past year, for a simple reason: in day-to-day business, there is pressure to quickly generate short-term profits. If your interest

Read More »

Bitcoin: What is the Best Day of the Week to Buy?

June 6, 2019

Shifting Patterns
In the last issue of Seasonal Insights I have discussed Bitcoin’s seasonal pattern in the course of a year. In this issue I will show an analysis of the returns of bitcoin on individual days of the week.
It seems to me that Bitcoin is particularly interesting for this type of study: it exhibits spectacular price gains, it is a very new instrument and it is unregulated. Moreover, it trades around the clock, even on weekends.
Given this setup, I found myself wondering: do prices rise uniformly? And does their performance on weekends differ from that on workdays?

Bitcoin, daily(see more posts on Bitcoin, )Bitcoin, daily – since bottoming in early December, BTC has advanced quite a bit. It remains an

Read More »

The Strongest Season for Silver Has Only Just Begun

January 18, 2019

Commodities as an Alternative
Our readers are presumably following commodity prices. Commodities often provide an alternative to investing in stocks – and they have clearly discernible seasonal characteristics. Thus heating oil tends to be cheaper in the summer than during the heating season in winter, and wheat is typically more expensive before the harvest then thereafter.
Precious metals are also subject to seasonal trends.  Today I want to put silver under a magnifying glass on your behalf. Its price has lagged the gold price significantly – the gold-silver price ratio currently stands above 80, which is close to historic highs.
Are seasonal patterns currently suggesting a positive outlook for silver?
Silver:

Read More »

The Interesting Seasonal Trends of Precious Metals

November 20, 2018

Precious Metals Patterns
Prices in financial and commodity markets exhibit seasonal trends. We have for example shown you how stocks of pharmaceutical companies tend to rise in winter due to higher demand, or the end-of-year rally phenomenon (last issue), which can be observed almost every year. Gold, silver, platinum and palladium are subject to seasonal trends as well.
Although gold and silver are generally perceived to trend in the same direction, there are actually big differences in their seasonal trends [PT]

Seasonal Analysis with our Web App
We have used our Web App (app.seasonax.com) to show you the seasonal trends in prices for precious metals. The chart below depicts the seasonal pattern of the gold

Read More »

How Dangerous is the Month of October?

October 9, 2018

A Month with a Bad Reputation
A certain degree of nervousness tends to suffuse global financial markets when the month of October approaches. The memories of sharp slumps that happened in this month in the past – often wiping out the profits of an entire year in a single day – are apt to induce fear. However, if one disregards outliers such as 1987 or 2008, October generally delivers an acceptable performance.
Nevertheless, the prospect of such an extremely strong decline is scary: what use is it to anyone if markets typically perform well in October most of the time, when  the phenomenon of the gains of an entire year evaporating in the blink of an eye is repeated? What about intermittent losses? We will apply

Read More »

Seasonality in Cryptocurrencies – An Interesting Pattern in Bitcoin

September 27, 2018

Looking for Opportunities
The last time we discussed Bitcoin was in May 2017 when we pointed out that Bitcoin too suffers from seasonal weakness in the summer. We have shown that a seasonal pattern in Bitcoin can be easily identified. More than a year has passed since then and readers may wonder why we have not addressed the topic again. There is a simple reason for this: the lack of extensive historical data for cryptocurrencies in combination with their extreme volatility.
This market will therefore become even more interesting for seasonal analysis once it becomes less volatile. However, crypto is still one of the hottest topics in finance. We have therefore decided to analyze the seasonal trends in Bitcoin to

Read More »

“Sell In May And Go Away” – A Reminder: In 9 Out Of 11 Countries It Makes Sense To Do So

May 29, 2018

A Truism that is Demonstrably True
Most people are probably aware of the adage “sell in May and go away”. This popular seasonal Wall Street truism implies that the market’s performance is far worse in the six summer months than in the six winter months. Numerous studies have been undertaken in this context particularly with respect to US stock markets, and they  confirm that the stock market on average exhibits relative weakness in the summer.
What is the status of the “sell in May” rule in other countries though? I have examined the patterns in the eleven most important stock markets in the world.
Look at the part we highlighted – it is downright eerie, Mark Twain somehow knew! [PT]
The Eleven Largest Markets in

Read More »

Global Turn-of-the-Month Effect – An Update

May 17, 2018

In Other Global Markets the “Turn-of-the-Month” Effect Generates Even Bigger Returns than in the US
The “turn-of-the-month” effect is one of the most fascinating stock market phenomena. It describes the fact that price gains primarily tend to occur around the turn of the month. By contrast, the rest of the time around the middle of the month is typically far less profitable for investors.
The effect has been studied extensively in the US market. In the last issue of Seasonal Insights I have shown a table detailing the extent of the “turn-of-the-month” effect in the eleven largest international stock markets.
The result was that overseas markets also tend to be significantly stronger around the turn of the month than

Read More »

The “Turn of the Month Effect” Exists in 11 of 11 Countries

April 22, 2018

A Well Known Seasonal Phenomenon in the US Market – Is There More to It?
I already discussed the “turn-of-the-month effect” in a previous issues of Seasonal Insights, see e.g. this report from earlier this year. The term describes the fact that price gains in the stock market tend to cluster around the turn of the month. By contrast, the rest of the time around the middle of the month is typically less profitable for investors.
With respect to the US stock market, I also showed how the “turn-of-the-month effect”” evolved over time, when it was particularly pronounced and when it tended to wane.  Does this effect have an impact on stock markets in other countries as well? I will examine this question in this issue of

Read More »

Trendline Broken: Similarities to 1929, 1987 and the Nikkei in 1990 Continue

March 30, 2018

Anatomy of Waterfall Declines
In an article published in these pages in early March, I have discussed the similarities between the current chart pattern in the S&P 500 Index compared to the patterns that formed ahead of the crashes of 1929 and 1987, as well as the crash-like plunge in the Nikkei 225 Index in 1990. The following five similarities were decisive features of these crash patterns:

– a rally along a clearly discernible trendline on a linear chart
– an accelerated move toward a peak at the end of the advance
– an initial decline testing the trendline
– a counter-trend rebound
– a break of the trendline

After the trendline was broken, waterfall declines began in the three antecedents of 1929, 1987 and the

Read More »

US Stock Market: Conspicuous Similarities with 1929, 1987 and Japan in 1990

March 7, 2018

Stretched to the Limit
There are good reasons to suspect that the bull market in US equities has been stretched to the limit. These include inter alia: high fundamental valuation levels, as e.g. illustrated by the Shiller P/E ratio (a.k.a. “CAPE”/ cyclically adjusted P/E); rising interest rates; and the maturity of the advance.
Near the end of a bull market cycle there is always the question of when a decline will begin, and above all, how large will it be. I believe it possible that the retreat in prices will begin soon and that it could possibly even start out with a crash. I will explain in the following what led me to draw this conclusion.

The end of an era – a little review of the mother of modern crash

Read More »

Market Efficiency? The Euro is Looking Forward to the Weekend!

February 25, 2018

Peculiar Behavior
As I have shown in previous issues of Seasonal Insights, various financial instruments are demonstrating peculiar behavior in the course of the week: the S&P 500 Index is typically strong on Tuesdays, Gold on Fridays and Bitcoin on Tuesdays (similar to the S&P 500 Index).
Several readers have inquired whether currencies exhibit such patterns as well. Are these extremely large markets also home to such statistical anomalies, or is market efficiency winning out in this case?
Let us take a closer look.

The quest for profitable foresight… – Click to enlarge

The Euro: Weak on Mondays, Strong on Fridays
Below I examine the performance of the EUR-USD exchange rate broken down by individual days of the

Read More »

Seasonality of Individual Stocks – an Update

February 15, 2018

Well Known Seasonal Trends
Readers are very likely aware of the “Halloween effect” or the Santa Claus rally. The former term refers to the fact that stocks on average tend to perform significantly worse in the summer months than in the winter months, the latter term describes the typically very strong advance in stocks just before the turn of the year. Both phenomena apply to the broad stock market, this is to say, to benchmark indexes such as the S&P 500 or the DJIA.
A number of individual stocks have their own “seasons” though, i.e., certain individual stocks have a habit of diverging from the major indexes and exhibit seasonal patterns of their own. I will illustrate this with an example that is relevant for the

Read More »

The FOMC Meeting Strategy: Why It May Be Particularly Promising Right Now

January 31, 2018

FOMC Strategy Revisited
As readers know, investment and trading decisions can be optimized with the help of statistics. One way of doing so is offered by the FOMC meeting strategy.

The rate hikes are actually leading somewhere – after the Wile E. Coyote moment, the FOMC meeting strategy is especially useful – Click to enlarge
A study published by the Federal Reserve Bank of New York in 2011 examined the effect of FOMC meetings on stock prices. The study concluded that these meetings have a substantial impact on stock prices – and contrary to what most investors would probably tend to expect, before rather than after the committee announces its monetary policy decision.

S&P 500 Index, Jan 1988 – 2018(see more

Read More »

2018: The Weakest Year in the Presidential Election Cycle Has Begun

January 13, 2018

The Vote Buying Mirror
Our readers are probably aware of the influence the US election cycle has on the stock market. After Donald Trump was elected president, a particularly strong rally in stock prices ensued.  Contrary to what many market participants seem to believe, trends in the stock market depend only to a negligible extent on whether a Republican or a Democrat wins the presidency. The market was e.g. just as strong under Democratic president Bill Clinton as it was under Republican president Ronald Reagan.

The mid terms specter.
From a statistical perspective, the decisive factor for the market trend is not the party allegiance of the president, but rather the year of the presidency. In this context we

Read More »

The Santa Claus Rally is Especially Pronounced in the DAX

December 10, 2017

The Gift that Keeps on Giving
Every year a certain stock market phenomenon is said to recur, anticipated with excitement by investors: the Santa Claus rally. It is held that stock prices typically rise quite frequently and particularly strongly just before the turn of the year.
I want to show you the Santa Claus rally in the German DAX Index as an example. Price moves are often exaggerated in the German stock market, which leads to quite pronounced – and hence profitable – seasonal trends.

Unbeknown to many, Santa Claus paid a high price for enriching investors – Click to enlarge

Recurring trends can be discerned at a glance on a seasonal chart
The chart below is not a standard chart that depicts a price trend

Read More »

The Precious Metals Bears’ Fear of Fridays

November 24, 2017

Peculiar Behavior
In the last issue of Seasonal Insights I have shown that the gold price behaves quite peculiarly in the course of the trading week. On average, prices rise almost exclusively on Friday. It is as though investors in this market were mired in deep sleep for most of the week.
Upon this I received a plethora of inquiries from readers regarding the corresponding moves in silver.  In response  examine the behavior of the silver market on individual days of the week in this issue of Seasonal Insights.

The title of this blog post is a play of words on the title of an early Wim Wender movie, The Goalkeeper’s Fear of the Penalty, which in turn is based on a famous novel by Peter Handke (sometimes the

Read More »

The Strange Behavior of Gold Investors from Monday to Thursday

November 10, 2017

Known and Unknown Anomalies
Readers are undoubtedly aware of one or another stock market anomaly, such as e.g. the frequently observed weakness in stock markets in the summer months, which the well-known saying “sell in May and go away” refers to. Apart from such widely known anomalies, there are many others though, which most investors have never heard of. These anomalies can be particularly interesting and profitable for investors – and there are several in the precious metals sector as well.  Today I am going to introduce one of those to you.

As Donald Rumsfeld, former secretary of defense knew, there are things we know we know, things we know we don’t know, and things we don’t know we don’t know (unfortunately

Read More »

Is a Rapid Advance in the Japanese Stock Market Imminent?

November 8, 2017

Japanese Market About to Break Out
The Japanese stock market is quite unique: it would need to rally by approximately 80% to reach its former historical peak. What’s more, said peak was attained on the final trading day of 1989, more than 25 years ago. In short, Japanese stocks have been anything but a good investment in recent years.
Conversely this means that the market has a lot of potential if it were to return to its former heights. It also means that the Japanese market hasn’t mirrored the excesses evident in many other stock markets.  The chart below shows the Nikkei 225 since its late 1989 peak.

Tokyo Nikkei Average, 1989 – 2018Nikkei 225, 1989 – 2017. Japanese stocks have entered a new uptrend. – Click to

Read More »

1987, 1997, 2007… Just How Crash-Prone are Years Ending in 7?

October 12, 2017

Bad Reputation
Years ending in 7, such as the current year 2017, have a bad reputation among stock market participants. Large price declines tend to occur quite frequently in these years.
Just think of 1987, the year in which the largest one-day decline in the US stock market in history took place:  the Dow Jones Industrial Average plunged by 22.61 percent in a single trading day. Or recall the year 2007, which marked the beginning of the GFC (“great financial crisis”).
Given that the current year is ending in 7 as well, is there a reason to be concerned, or is the year 7 crash  pattern a myth?

Sliding down the steep slope of the cursed year. – Click to enlarge
 

The Pattern of the Dow Jones Industrial Average

Read More »

S&P 500 Index: A Single Day Beats the Entire Week!

September 5, 2017

Recurring Phenomena
Many market participants believe simple phenomena in the stock market are purely random events and cannot recur consistently. Indeed, there is probably no stock market “rule” that will remain valid forever.
However, there continue to be certain statistical phenomena in the stock market – even quite simple ones – that have shown a tendency to persist for very long time periods.
In today’s report I examine such a phenomenon: namely, the performance of the S&P 500 Index on individual days of the week.

US S&P 500 Large Cap Index(see more posts on S&P 500, )This chart illustrates a “rule that changed” – for eight decades (actually longer, but on this chart we can see the final eight decades during

Read More »

Is Historically Low Volatility About to Expand?

August 18, 2017

Suspicion Asleep
You have probably noticed it already: stock market volatility has recently all but disappeared. This raises an important question for every investor: Has the market established a permanent plateau of low volatility, or is the current period of low volatility just the calm before the storm?
When such questions regarding future market trends arise, it is often worthwhile to examine market history.
For the purpose of analyzing volatility I have used one of the longest time series available, namely the Dow Jones Industrial Average (DJIA) from 1915 onward – which represents more than a century of price history. In order to improve comparability, I have removed Saturdays, which used to be trading days in

Read More »

Russell 2000: The Dangerous Season Begins Now

July 21, 2017

Old Truism
Readers are surely aware of the saying “sell in May and go away”. It is one of the best-known and oldest stock market truisms.
And the saying is justified. In my article “Sell in May and Go Away – in 9 out of 11 Countries it Makes Sense to Do So” in the May 01 2017 issue of Seasonal Insights I examined the so-called Halloween effect in great detail. The result: in just two out of eleven international stock markets does it make sense to invest during the summer months.
But is “sell in May” really the best recommendation? After all, it is merely a saying based on general experience. We will take a closer look at the seasonal pattern below.
October meetings after you forgot to sell in May [PT]

The Precise

Read More »

“Sell in May”: Good Advice – But Is There a Better Way?

May 21, 2017

Selling in May, With Precision
If you “sell in May and go away”, you are definitely on the right side of the trend from a statistical perspective: While gains were achieved in the summer months in three of the eleven largest stock markets in the world, they amounted to less than one percent on average. In six countries stocks even exhibited losses! Only in two countries would an investment represent an interesting proposition, as I have shown in the last issue of Seasonal Insights via back-test calculations for the time period 1970 to today.

The perennial stock market question: when is the right time? [PT] – Click to enlarge
But does it really make sense to sell at the beginning of May and buy one’s position back again after six months? After all, it seems a bit strange to assume that stock market behavior will adhere precisely to a time period of six months.
Below we will take a look at how one can improve investment results in this context by applying a modified set of rules.

S&P 500 Index: Seasonal Average(see more posts on S&P 500 Index, )A 30 year seasonal chart of the S&P 500 Index – as you will see further below, its behavior in the weak seasonal period is very similar to that of the market Dimitri picked as an example.

Read More »