 Swiss Economicblogs.org
Bent and Distorted POITOU, FRANCE – This morning, we are wondering: How dumb is the Fed? The question was prompted by this comment by former Fed insider Chris Whalen at The Institutional Risk Analyst blog. [O]ur message to the folks in Jackson Hole this week [at the annual central banker meeting there] is that the end of the Fed’s reckless experiment in social engineering via QE and near-zero interest rates will end...
Read More »The Anatomy of Brown’s Gold Bottom – Precious Metals Supply and Demand

See the introduction and the video for the terms gold basis, co-basis, backwardation and contango. The Socialist Politician-Bureaucrat with the Worst Timing Ever As most in the gold community know, the UK Chancellor of the Exchequer Gordon Brown announced on 7 May, 1999 that HM Treasury planned to sell gold. The dollar began to rise, from about 110mg gold to 120mg on 6 July, the day of the first sale. This translates...
Read More »The Gold Conundrum

Keeping it Simple We recently (on Thursday last week to be precise) put together a few gold-related charts based on the “keep it simple” principle. The annual Incrementum “In Gold We Trust” report is going to be published shortly and contains a quite thorough technical analysis section, so we will keep this brief and just discuss a few things that have caught our eye. So what is the “conundrum”? We will get to that...
Read More »Moving Closer to the Precipice

Money Supply and Credit Growth Continue to Falter The decline in the growth rate of the broad US money supply measure TMS-2 that started last November continues, but the momentum of the decline has slowed last month (TMS = “true money supply”). The data were recently updated to the end of April, as of which the year-on-year growth rate of TMS-2 is clocking in at 6.05%, a slight decrease from the 6.12% growth rate...
Read More »“Sell in May”: Good Advice – But Is There a Better Way?

Selling in May, With Precision If you “sell in May and go away”, you are definitely on the right side of the trend from a statistical perspective: While gains were achieved in the summer months in three of the eleven largest stock markets in the world, they amounted to less than one percent on average. In six countries stocks even exhibited losses! Only in two countries would an investment represent an interesting...
Read More »Rising Oil Prices Don’t Cause Inflation
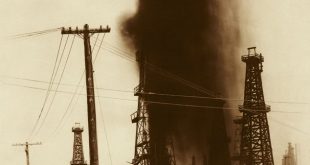
Correlation vs. Causation A very good visual correlation between the yearly percentage change in the consumer price index (CPI) and the yearly percentage change in the price of oil seems to provide support to the popular thinking that future changes in price inflation in the US are likely to be set by the yearly growth rate in the price of oil (see first chart below). Gushing forth… a Union Oil Co. oil well sometime...
Read More »A Cloud Hangs Over the Oil Sector

Endangered Recovery As we noted in a recent corporate debt update on occasion of the troubles Neiman-Marcus finds itself in (see “Cracks in Ponzi Finance Land”), problems are set to emerge among high-yield borrowers in the US retail sector this year. This happens just as similar problems among low-rated borrowers in the oil sector were mitigated by the rally in oil prices since early 2016. The recovery in the oil...
Read More »The Triumph of Hope over Experience

The Guessers Convocation On Wednesday the socialist central planning agency that has bedeviled the market economy for more than a century held one of its regular meetings. Thereafter it informed us about its reading of the bird entrails via statement (one could call this a verbose form of groping in the dark). A number of people have wondered why the Fed seems so uncommonly eager all of a sudden to keep hiking rates...
Read More »“Sell in May and Go Away” – in 9 out of 11 Countries it Makes Sense to Do So
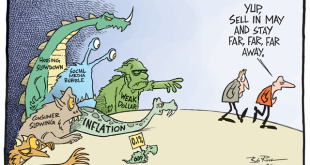
An Old Seasonal Truism Most people are probably aware of the saying “sell in May and go away”. This popular seasonal Wall Street truism implies that the market’s performance is far worse in the six summer months than in the six winter months. Numerous studies have been undertaken particularly with respect to US stock markets, which confirm the relative weakness of the stock market in the summer months. What is the...
Read More »Simple Math of Bank Horse-Puckey

The Raw Deal We stepped out on our front stoop Wednesday morning and paused to take it all in. The sky was at its darkest hour just before dawn. The air was crisp. There was a soft coastal fog. The faint light of several stars that likely burned out millennia ago danced just above the glow of the street lights. After a brief moment, we locked the door behind us and got into our car. Springtime southern California...
Read More »