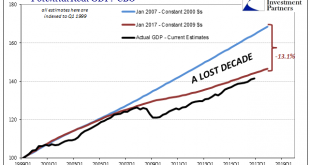
It is largely irrelevant, but still the political theater is fascinating. As is now standard operating procedure, whatever comes out of the Trump administration immediately is conferred as the standard for awful. This is not my own determination, mind you, but that of the mainstream, whatever that is these days. And so it is with the first set of budget figures that include very robust growth projections, a point of...
Read More »US GDP Misses, but Final Domestic Sales Accelerate
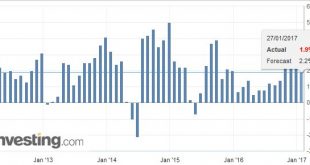
Summary: Net exports was a large drag on growth. Inventories flattered growth. Underlying signal, final domestic demand, increased 2.5% after 2.1% in Q3. The first estimate of Q4 16 US GDP undershot expectations at 1.9%.Most had looked for annualized pace of a little more than 2% after the 3.5% pace in Q3. The Q3 pace was always suspect given the unsustainable surge in agriculture (soy) exports. Net exports...
Read More »Ageing Economies Grew Faster
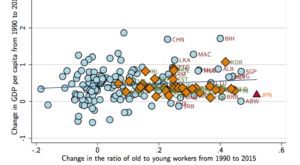
That’s what Daron Acemoglu and Pascual Restrepo document in an NBER working paper. Figure 2 [below] provides a glimpse of the relevant pattern by depicting the raw correlation between the change in GDP per capita between 1990 and 2015 and the change in the ratio of the population above 50 to the population between the ages of 20 and 49. … even when we control for initial GDP per capita, initial demographic composition and differential trends by region, there is no evidence of a negative...
Read More »Some Thoughts on Q3 US GDP
Summary: US Q3 was revised higher mostly due to consumption. Business investment was a drag. Profits rose to snap a five-quarter slide. The US economy now is estimated to have expanded by 3.2% in Q3, up from the initial estimate of 2.9%, and is the fasted in since Q3 2014. The average quarterly growth rate this year is 1.8% compared with 1.9% last year. The Federal Reserve estimates trend growth or the...
Read More »“Fehldiagnose Secular Stagnation (Secular Stagnation Skepticism),” FuW, 2016
Finanz und Wirtschaft, November 23, 2016. PDF. The diagnosis is far from clear. Nor is the therapy.
Read More »Conference in Honor of Bob King at the Study Center Gerzensee
Jointly with the Journal of Monetary Economics and the Swiss National Bank, the Study Center Gerzensee organized a conference in honor of Bob King, long-term supporter of the Study Center. Program: PDF. Jaume Ventura’s discussion of a paper on trade and growth by Alvarez and Lucas: PDF. My discussion of a paper on debt and debt constraints by Bhandari, Evans, Golosov, and Sargent: PDF.
Read More »Yellen and Fischer Still Singing from the Same Song Book
Introduction by George Dorgan My articles About meMy booksFollow on:TwitterFacebookGoogle +YoutubeSeeking AlphaCFA SocietyLinkedINEconomicBlogs Summary: Many see Yellen and Fischer at odds over benefits of high pressure economy. However, this fails to put the comments in the proper context–same message different styles. They are arguing against the doves who don’t want to hike this year. Many observers are...
Read More »Demographics and a New Old Paradigm
Summary: The hangover from the debt crisis and secular stagnation are the two main explanatory models for the low growth and low interest rates. Anew Fed paper brings the focus back to demographics. If true, warns of a protracted period of slow growth, low interest rates. There are two main interpretative frameworks that seek to explain the slow growth and low interest rates. The first is associated with...
Read More »Dynamics of the World Income Distribution
In a Resolution Foundation report, Adam Corlett examines the “Elephant Curve.” The curve shows that between 1988 and 2008 income growth in the 70th to 95th percentile range of the world income distribution was much lower than for almost all other percentiles. Since the lower middle class of rich countries is situated around the 80th percentile of the distribution the Elephant curve has been interpreted as evidence for stagnating middle class incomes in the rich countries. Corlett...
Read More » Swiss Economicblogs.org


