See the introduction and the video for the terms gold basis, co-basis, backwardation and contango. Smoke Signals Gold went up by 33 of the Master’s Notes, but silver went up only 22 of the His Cents. The rising gold-silver ratio is one thing we add to others that signal the not-good economy. Silver has industrial uses, but gold basically does not. So a rising ratio shows rising monetary demand relative to industrial demand. Copper, remember when everyone heralded copper as either a signal of rising inflation or a growing economy? What a difference three months and 36 cents makes. Now, with a falling price and a 2-handle once again, copper is predicting neither. Add a protracted tumble in stocks, rising interest
Topics:
Keith Weiner considers the following as important: dollar price, Featured, Gold and its price, gold basis, Gold co-basis, gold prices, gold silver ratio, newsletter, Precious Metals, silver basis, Silver co-basis, silver prices
This could be interesting, too:
Vibhu Vikramaditya writes Navigating the Slippery Slope: How Hoover’s Interventions Paved the Way for the Great Depression
Ryan McMaken writes Frédéric Bastiat Was a Radical Opponent of War and Militarism
Douglas French writes Millennials: In Costco We Trust
Joseph T. Salerno writes What Fed “Independence” Really Means
See the introduction and the video for the terms gold basis, co-basis, backwardation and contango.
Smoke SignalsGold went up by 33 of the Master’s Notes, but silver went up only 22 of the His Cents. The rising gold-silver ratio is one thing we add to others that signal the not-good economy. Silver has industrial uses, but gold basically does not. So a rising ratio shows rising monetary demand relative to industrial demand. Copper, remember when everyone heralded copper as either a signal of rising inflation or a growing economy? What a difference three months and 36 cents makes. Now, with a falling price and a 2-handle once again, copper is predicting neither. Add a protracted tumble in stocks, rising interest rates – especially a growing spread between the interbank rate and the comparable-duration Treasury – and you have a picture of an economy stumbling once again. Or perhaps something more serious, we shall see. Silver bugs may be forgiven their enthusiasm to buy the white metal in preference to the yellow, at this gold-silver ratio. From a historical perspective, they are likely to do well with the trade. However, those who claim that silver has outperformed gold as smoking something, and we mean of the sort that President Trump would like to execute the dealer who sold it to them. By definition, for the ratio to rise from about 31 in 2011, to its present well over 81, silver has underperformed gold. Massively. |
 Decrepit though he may be… it’s still his funny money, and he always wants more of it. - Click to enlarge |
Fundamental Developments – Fundamental Gold Price at 3 Year HighLet’s take a look at the only true picture of the supply and demand fundamentals for the metals. But first, here is the chart of the prices of gold and silver. |
Gold and Silver Prices(see more posts on Gold prices, silver prices, )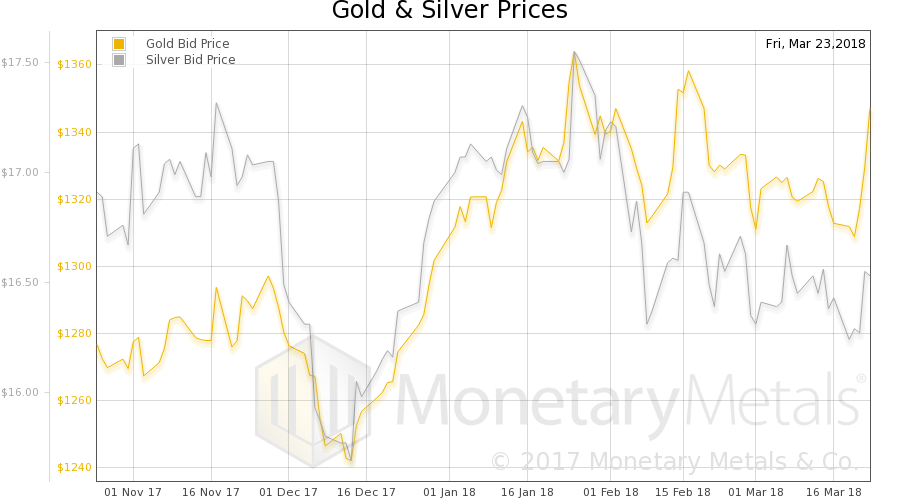 Gold and silver priced in USD - Click to enlarge |
| Next, this is a graph of the gold price measured in silver, otherwise known as the gold to silver ratio (see here for an explanation of bid and offer prices for the ratio). The ratio rose about another point. |
Gold:Silver Ratio(see more posts on gold silver ratio, )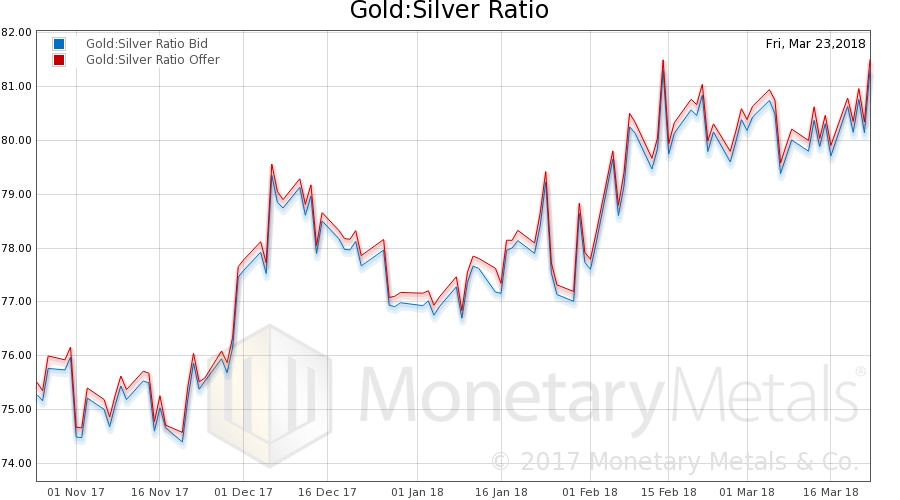 Gold-silver ratio, bid and offer - Click to enlarge |
| Here is the gold graph showing gold basis, co-basis and the price of the dollar in terms of gold price.
There is a big change in the dollar, down 0.7mg gold (the opposite of gold going up as measured by the Master’s Notes). But with this rise, we see little increase in the metal’s abundance to the market. This is a sign of fundamental buying, of metal not of futures. The Monetary Metals Gold Fundamental Price rose $21 this week, to $1,440. This is the highest in exactly three years. |
Gold Basis, Co-basis and the Dollar Price(see more posts on dollar price, gold basis, Gold co-basis, )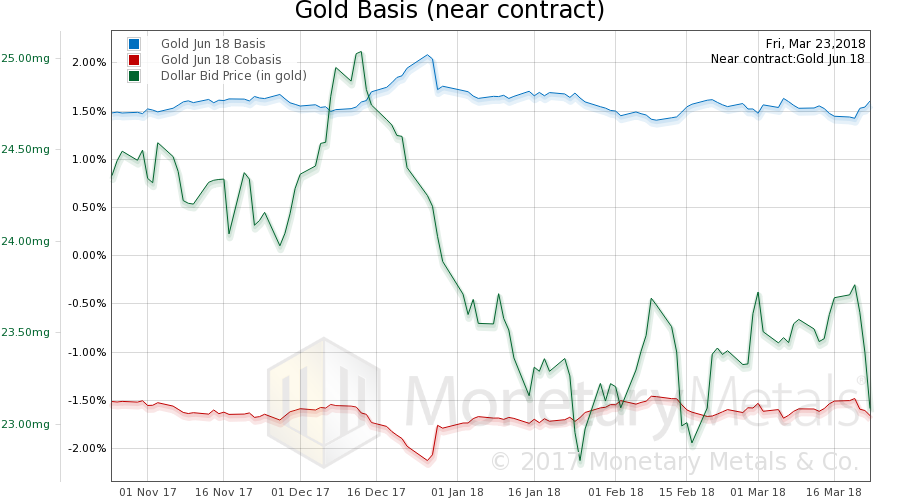 Gold basis, co-basis and the USD priced in milligrams of gold - Click to enlarge |
| Now let’s look at silver.
In silver, there is a bigger drop in the scarcity (red line, co-basis) while silver went up less in terms of MN’s. The absolute level of the co-basis is much higher, but this is partly due to the nearer expiration of the May silver contract (vs June gold contract). The silver basis continuous is higher than the gold basis continuous. Unsurprisingly, the Monetary Metals Silver Fundamental Price fell 9 cents to $17.27. We could see a gold-silver ratio at 83 if this keeps up. |
Silver Basis, Co-basis and the Dollar Price(see more posts on dollar price, silver basis, Silver co-basis, )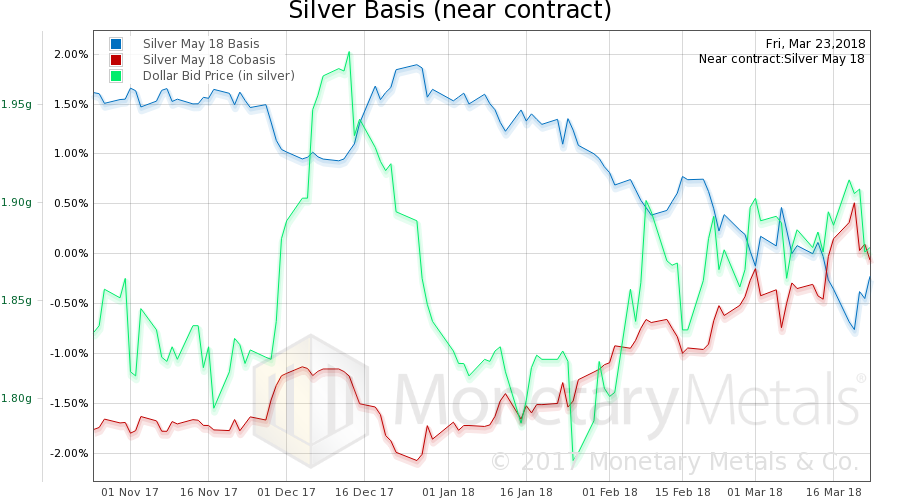 Silver basis, co-basis and the USD priced in grams of silver - Click to enlarge |
© 2018 Monetary Metals
Charts by: Monetary Metals
Chart and image captions by PT
Tags: dollar price,Featured,gold basis,Gold co-basis,Gold prices,gold silver ratio,newsletter,Precious Metals,silver basis,Silver co-basis,silver prices